Marietta‘s popular HarvestFest is returning to Glover Park on Marietta Square on Saturday, October 19, 2024 from 9 a.m. – 5 p.m.
Some of the features of the 47th annual festival are:
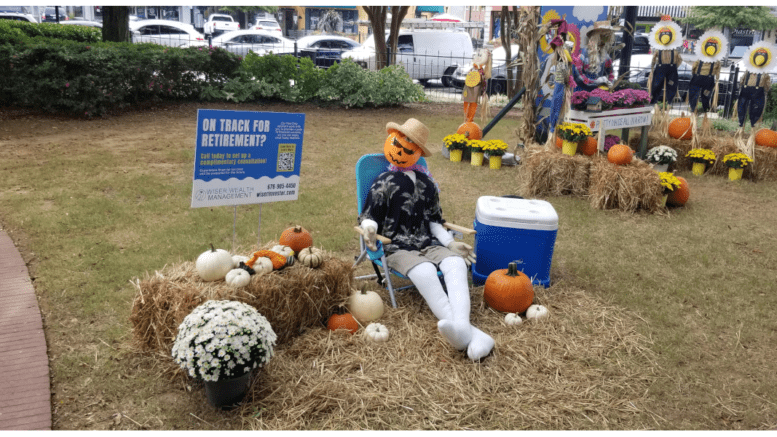
- Scarecrows in the Square, were individuals and organizations display their creativity by putting together dazzling and often humerous scarecrows
- The HarvestFest Market
- Touch-a-Truck, an event that fascinates children and adults alike
- A Costume Contest
- A Pie-eating contest presented by the Pie Bar
- And a Halloween Happenings kid’s festival
Glover Park is located at 50 N Park Square NE Marietta, GA 30060
For further information visit https://www.mariettaga.gov/1258/HarvestFest
About the City of Marietta
The City of Marietta is the county seat of Cobb County. The latest estimate from the U.S. Census Bureau puts the population of the city at 60,867 which makes it the second largest city in Cobb County by population, smaller only than the newly incorporated City of Mableton.
Here are a few quick facts from the Census Bureau
| Population | |
| Population estimates, July 1, 2023, (V2023) | 62,769 |
| Population estimates base, April 1, 2020, (V2023) | 61,073 |
| Population, percent change – April 1, 2020 (estimates base) to July 1, 2023, (V2023) | 2.8% |
| Population, Census, April 1, 2020 | 60,972 |
| Population, Census, April 1, 2010 | 56,579 |
| Age and Sex | |
| Persons under 5 years, percent | 6.0% |
| Persons under 18 years, percent | 20.7% |
| Persons 65 years and over, percent | 14.2% |
| Female persons, percent | 51.3% |
| Race and Hispanic Origin | |
| White alone, percent | 45.3% |
| Black or African American alone, percent(a) | 30.8% |
| American Indian and Alaska Native alone, percent(a) | 1.3% |
| Asian alone, percent(a) | 2.1% |
| Native Hawaiian and Other Pacific Islander alone, percent(a) | 0.0% |
| Two or More Races, percent | 8.6% |
| Hispanic or Latino, percent(b) | 18.8% |
| White alone, not Hispanic or Latino, percent | 42.4% |
| Population Characteristics | |
| Veterans, 2018-2022 | 2,377 |
| Foreign born persons, percent, 2018-2022 | 17.2% |
| Housing | |
| Housing Units, July 1, 2023, (V2023) | X |
| Owner-occupied housing unit rate, 2018-2022 | 46.2% |
| Median value of owner-occupied housing units, 2018-2022 | $376,400 |
| Median selected monthly owner costs -with a mortgage, 2018-2022 | $2,050 |
| Median selected monthly owner costs -without a mortgage, 2018-2022 | $569 |
| Median gross rent, 2018-2022 | $1,372 |
| Building Permits, 2023 | X |
| Families & Living Arrangements | |
| Households, 2018-2022 | 24,403 |
| Persons per household, 2018-2022 | 2.39 |
| Living in same house 1 year ago, percent of persons age 1 year+, 2018-2022 | 79.1% |
| Language other than English spoken at home, percent of persons age 5 years+, 2018-2022 | 24.3% |
| Computer and Internet Use | |
| Households with a computer, percent, 2018-2022 | 97.2% |
| Households with a broadband Internet subscription, percent, 2018-2022 | 91.3% |
| Education | |
| High school graduate or higher, percent of persons age 25 years+, 2018-2022 | 88.5% |
| Bachelor’s degree or higher, percent of persons age 25 years+, 2018-2022 | 45.8% |
| Health | |
| With a disability, under age 65 years, percent, 2018-2022 | 6.7% |
| Persons without health insurance, under age 65 years, percent | 21.6% |
| Economy | |
| In civilian labor force, total, percent of population age 16 years+, 2018-2022 | 67.6% |
| In civilian labor force, female, percent of population age 16 years+, 2018-2022 | 61.1% |
| Total accommodation and food services sales, 2017 ($1,000)(c) | 282,938 |
| Total health care and social assistance receipts/revenue, 2017 ($1,000)(c) | 2,324,868 |
| Total transportation and warehousing receipts/revenue, 2017 ($1,000)(c) | 492,100 |
| Total retail sales, 2017 ($1,000)(c) | 2,099,654 |
| Total retail sales per capita, 2017(c) | $34,643 |
| Transportation | |
| Mean travel time to work (minutes), workers age 16 years+, 2018-2022 | 27.3 |
| Income & Poverty | |
| Median household income (in 2022 dollars), 2018-2022 | $67,589 |
| Per capita income in past 12 months (in 2022 dollars), 2018-2022 | $40,767 |
| Persons in poverty, percent | 12.8% |
| Businesses | |
| Total employer establishments, 2022 | X |
| Total employment, 2022 | X |
| Total annual payroll, 2022 ($1,000) | X |
| Total employment, percent change, 2021-2022 | X |
| Total nonemployer establishments, 2021 | X |
| All employer firms, Reference year 2017 | 3,152 |
| Men-owned employer firms, Reference year 2017 | 1,993 |
| Women-owned employer firms, Reference year 2017 | S |
| Minority-owned employer firms, Reference year 2017 | 505 |
| Nonminority-owned employer firms, Reference year 2017 | 2,146 |
| Veteran-owned employer firms, Reference year 2017 | 193 |
| Nonveteran-owned employer firms, Reference year 2017 | 2,443 |
| Geography | |
| Population per square mile, 2020 | 2,602.0 |
| Population per square mile, 2010 | 2,451.4 |
| Land area in square miles, 2020 | 23.43 |
| Land area in square miles, 2010 | 23.08 |
| FIPS Code | 1349756 |