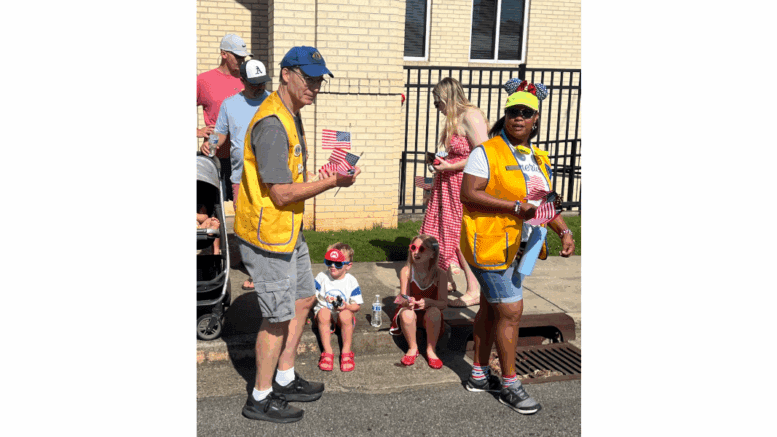
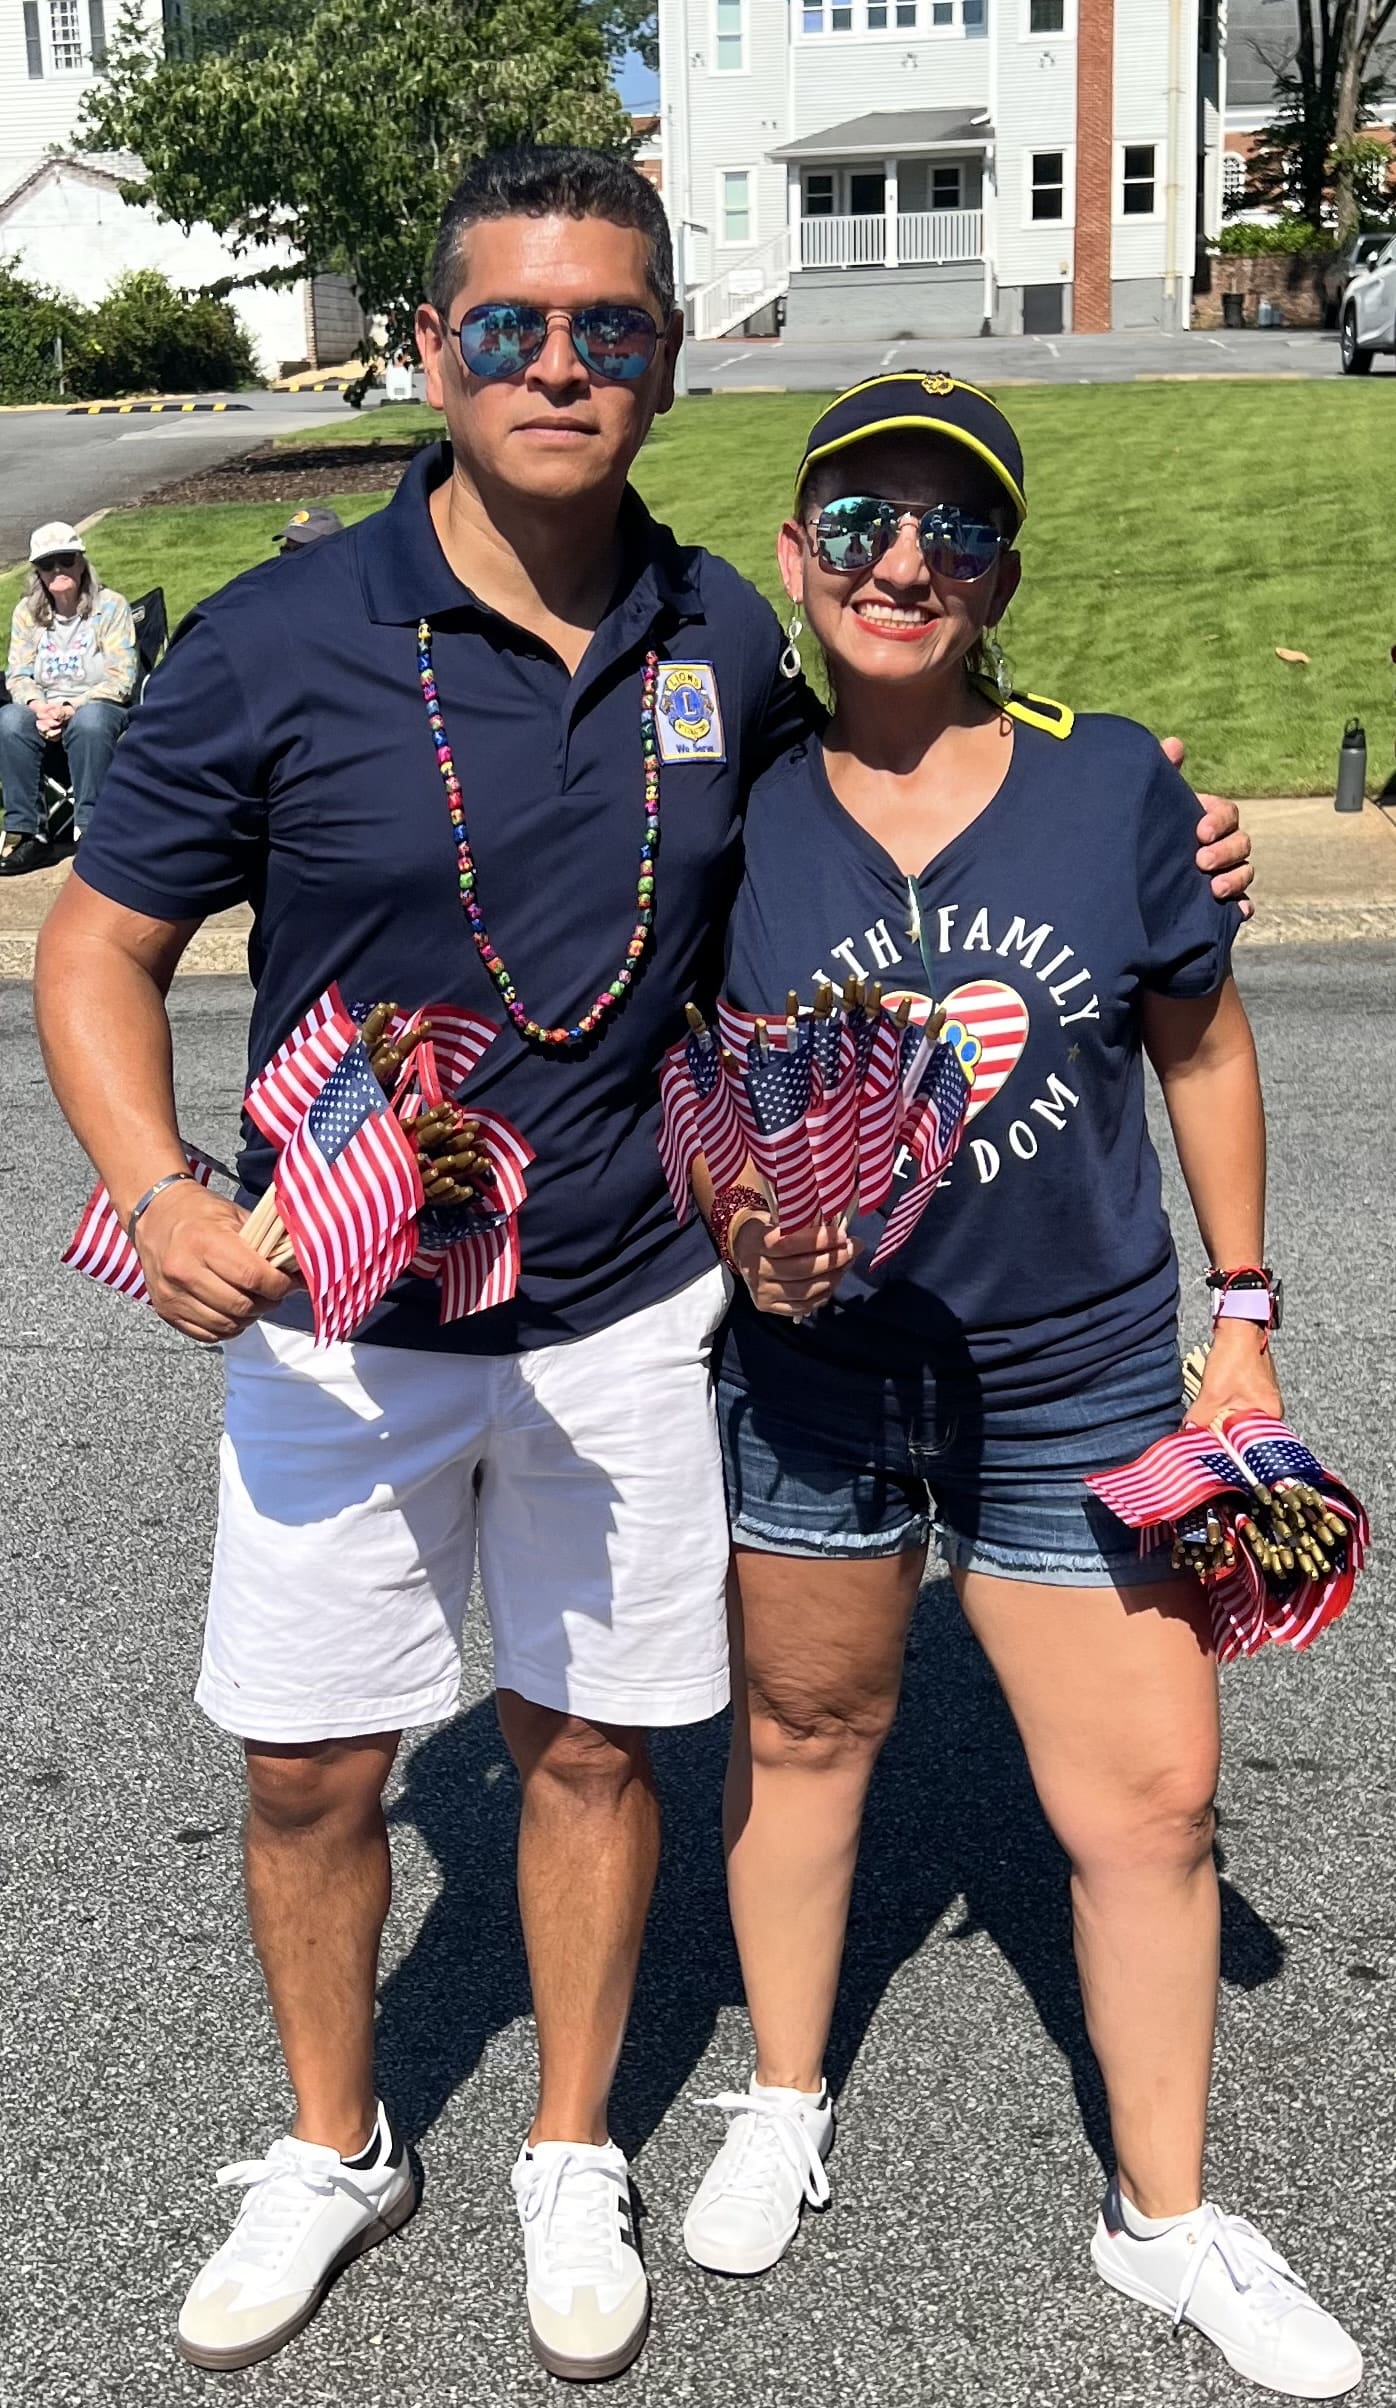
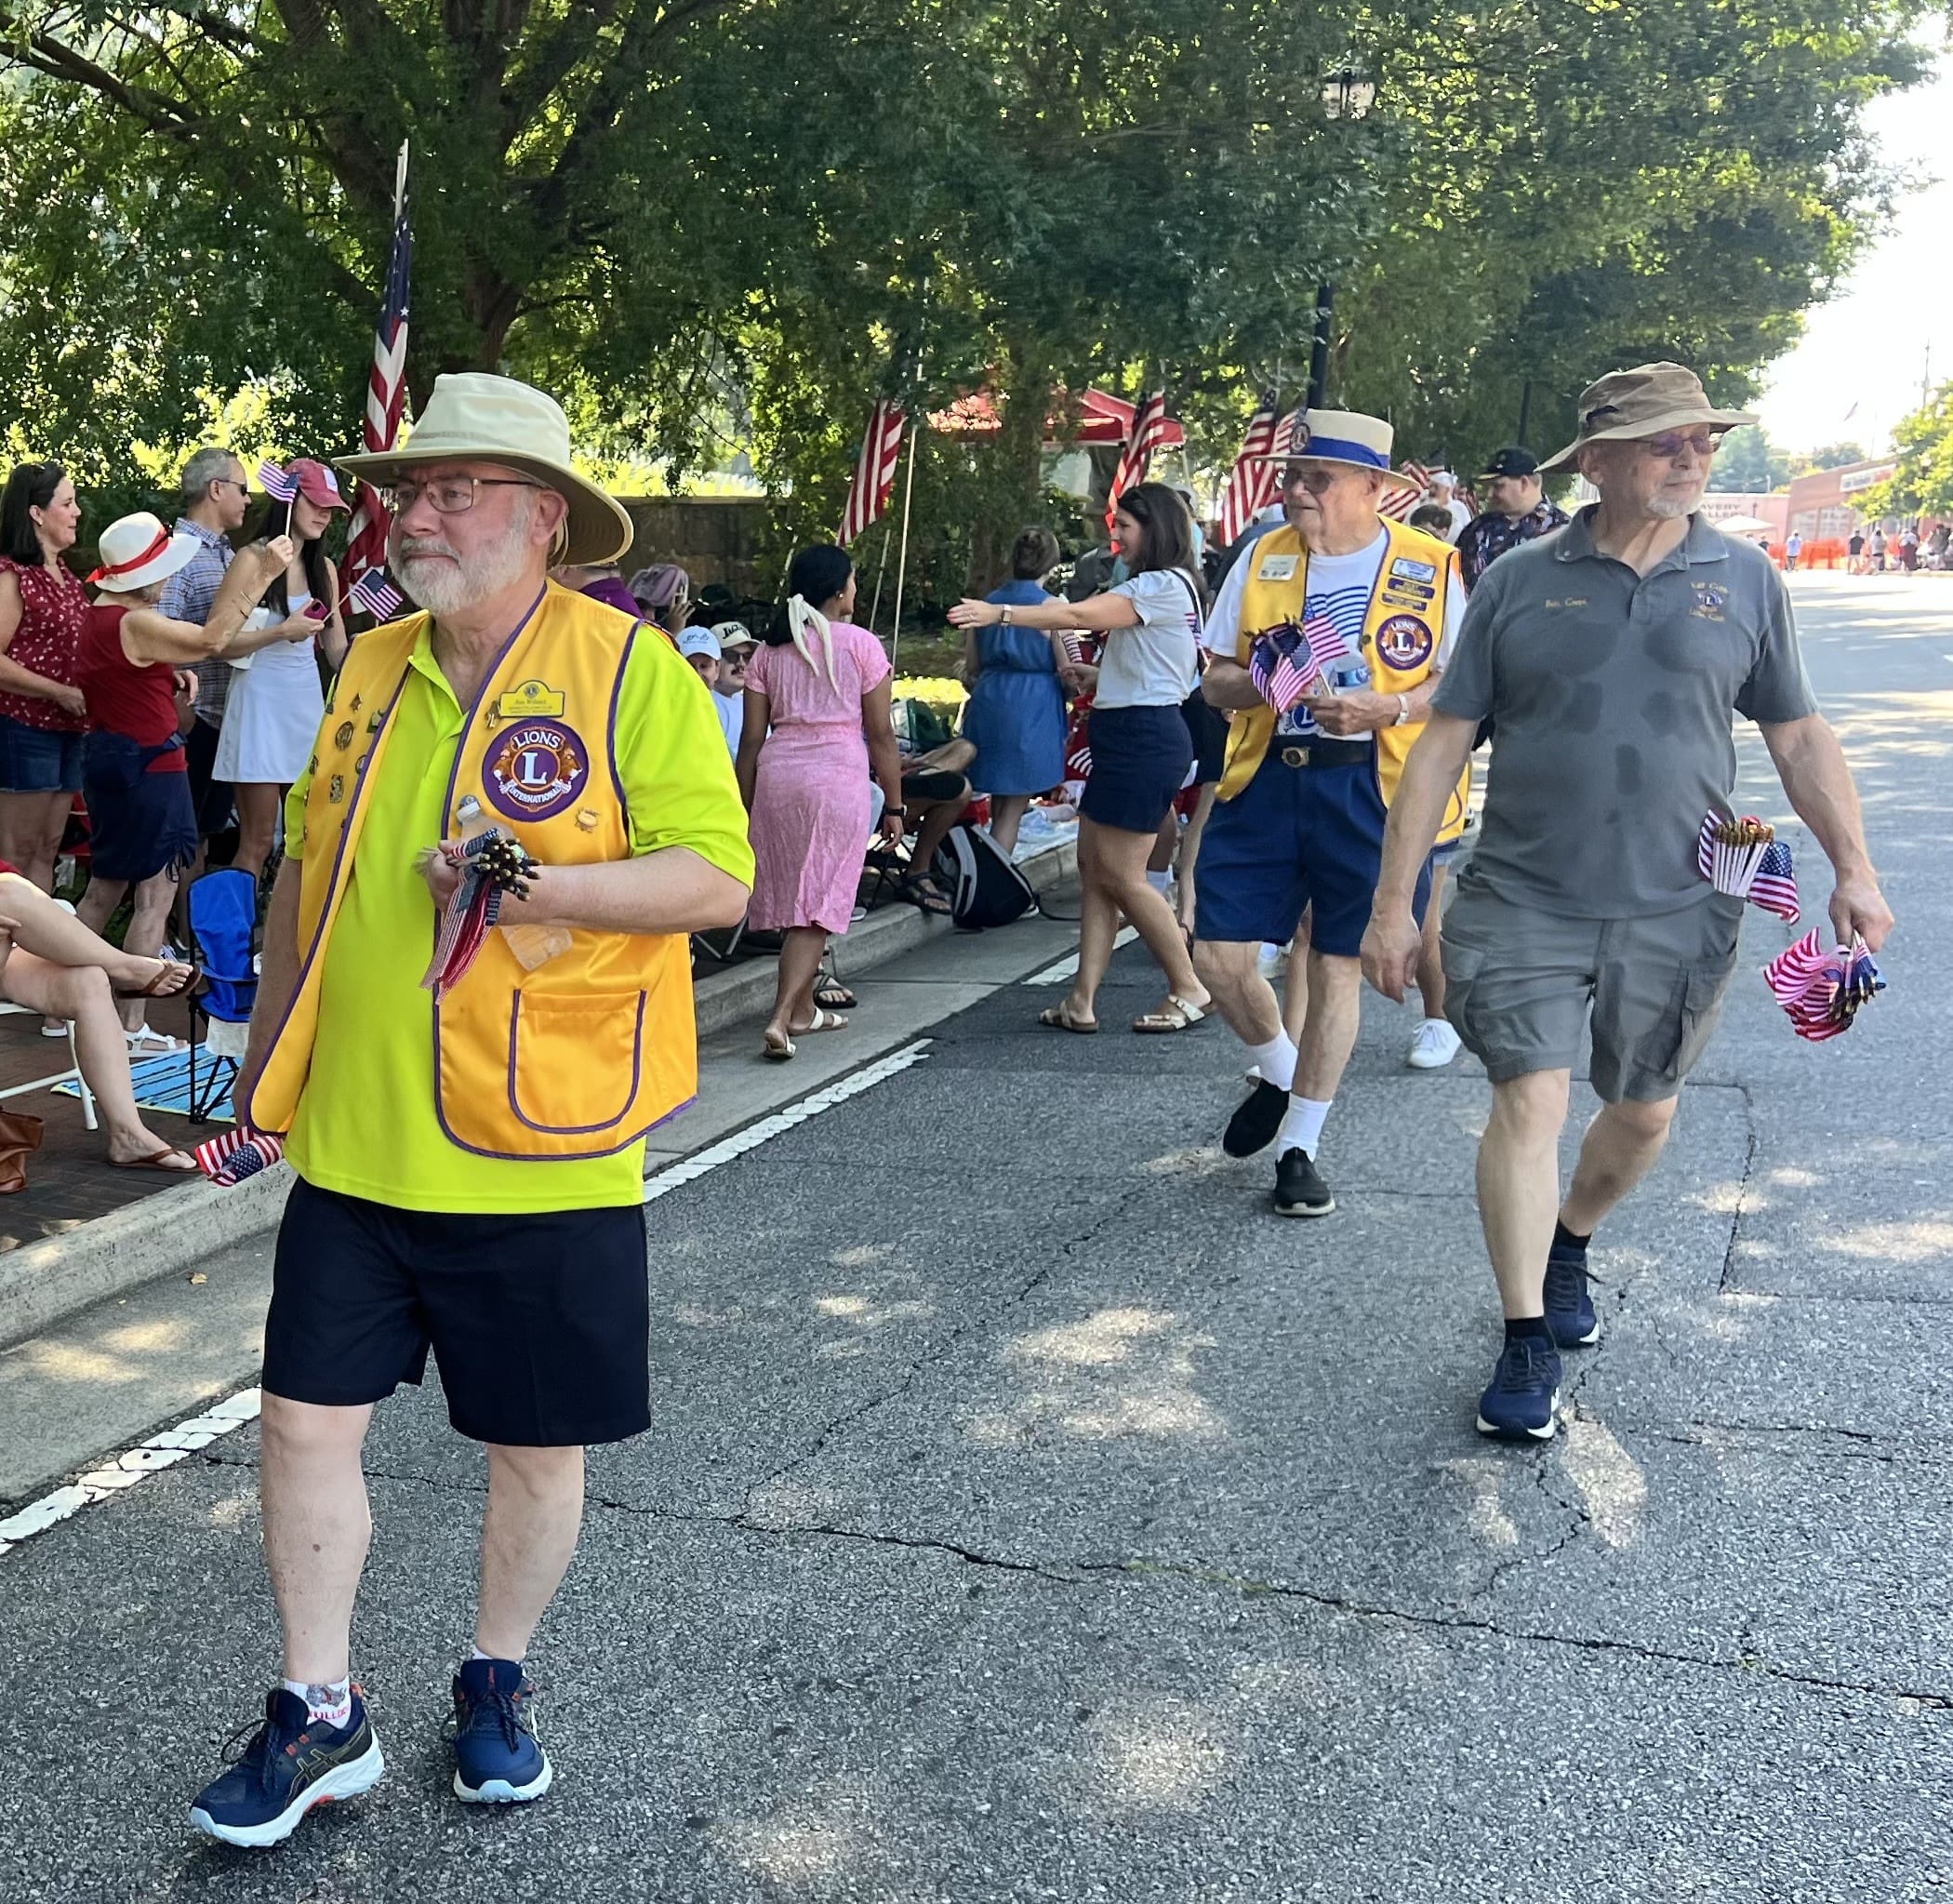
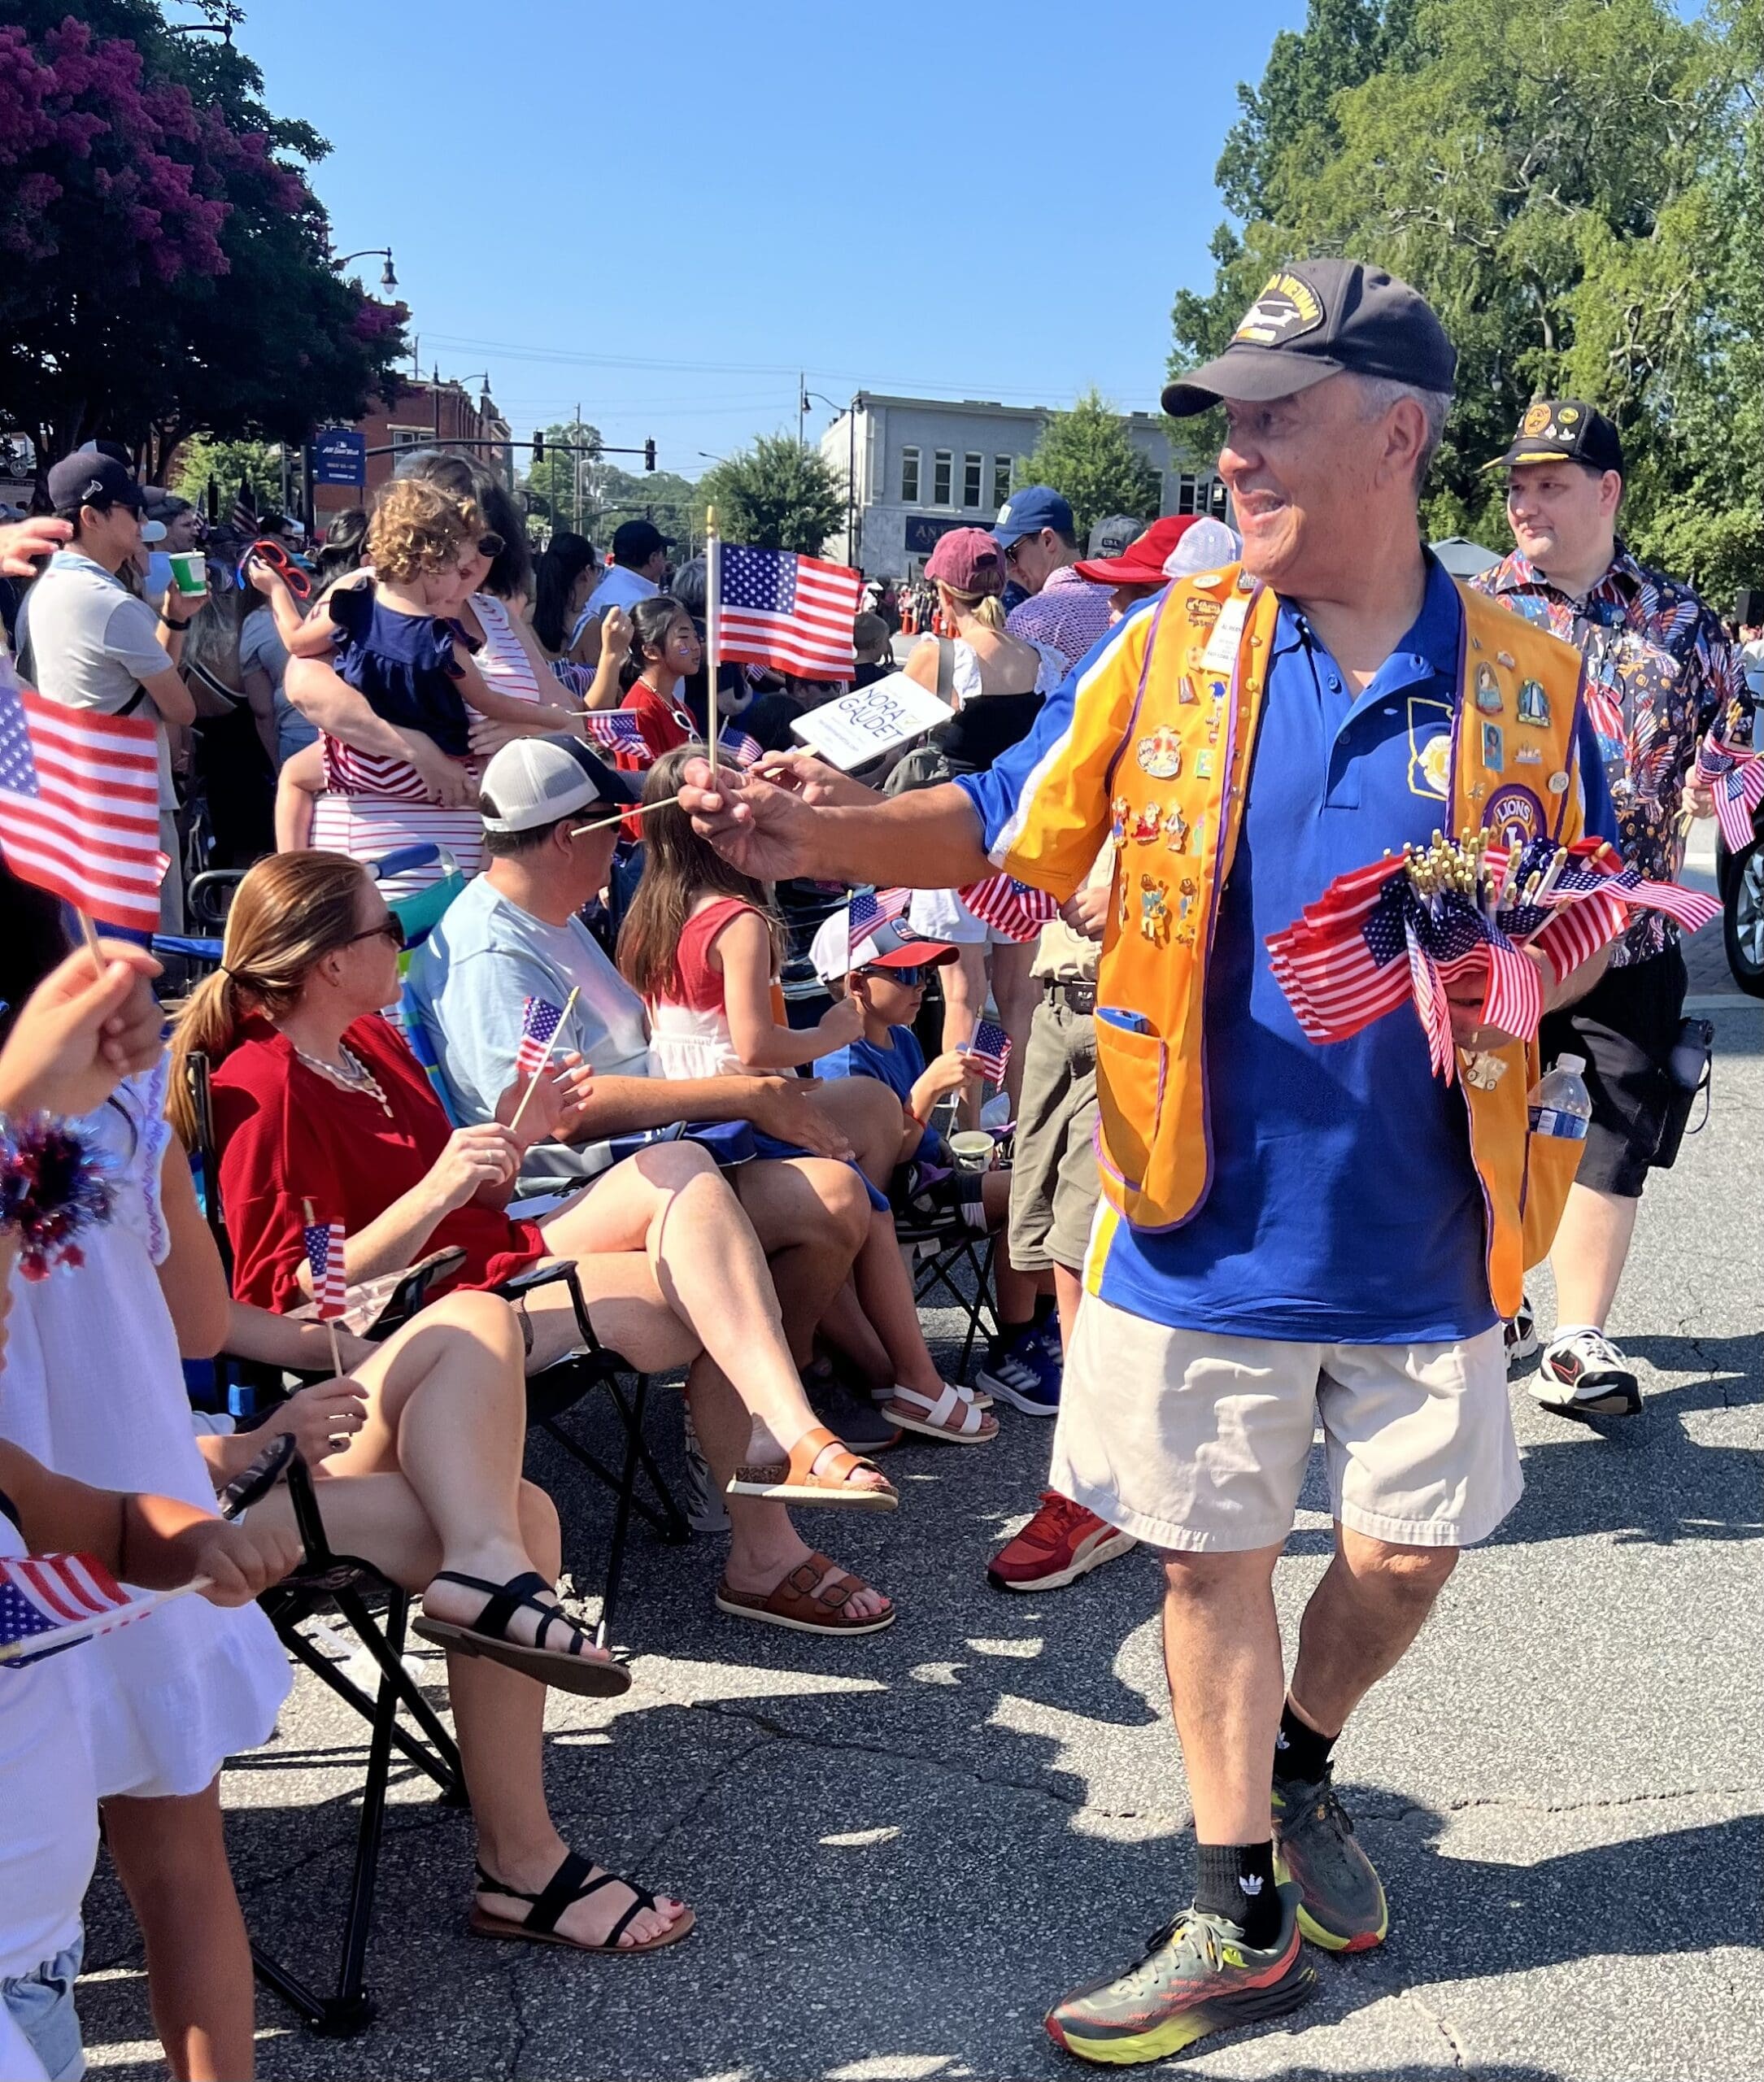
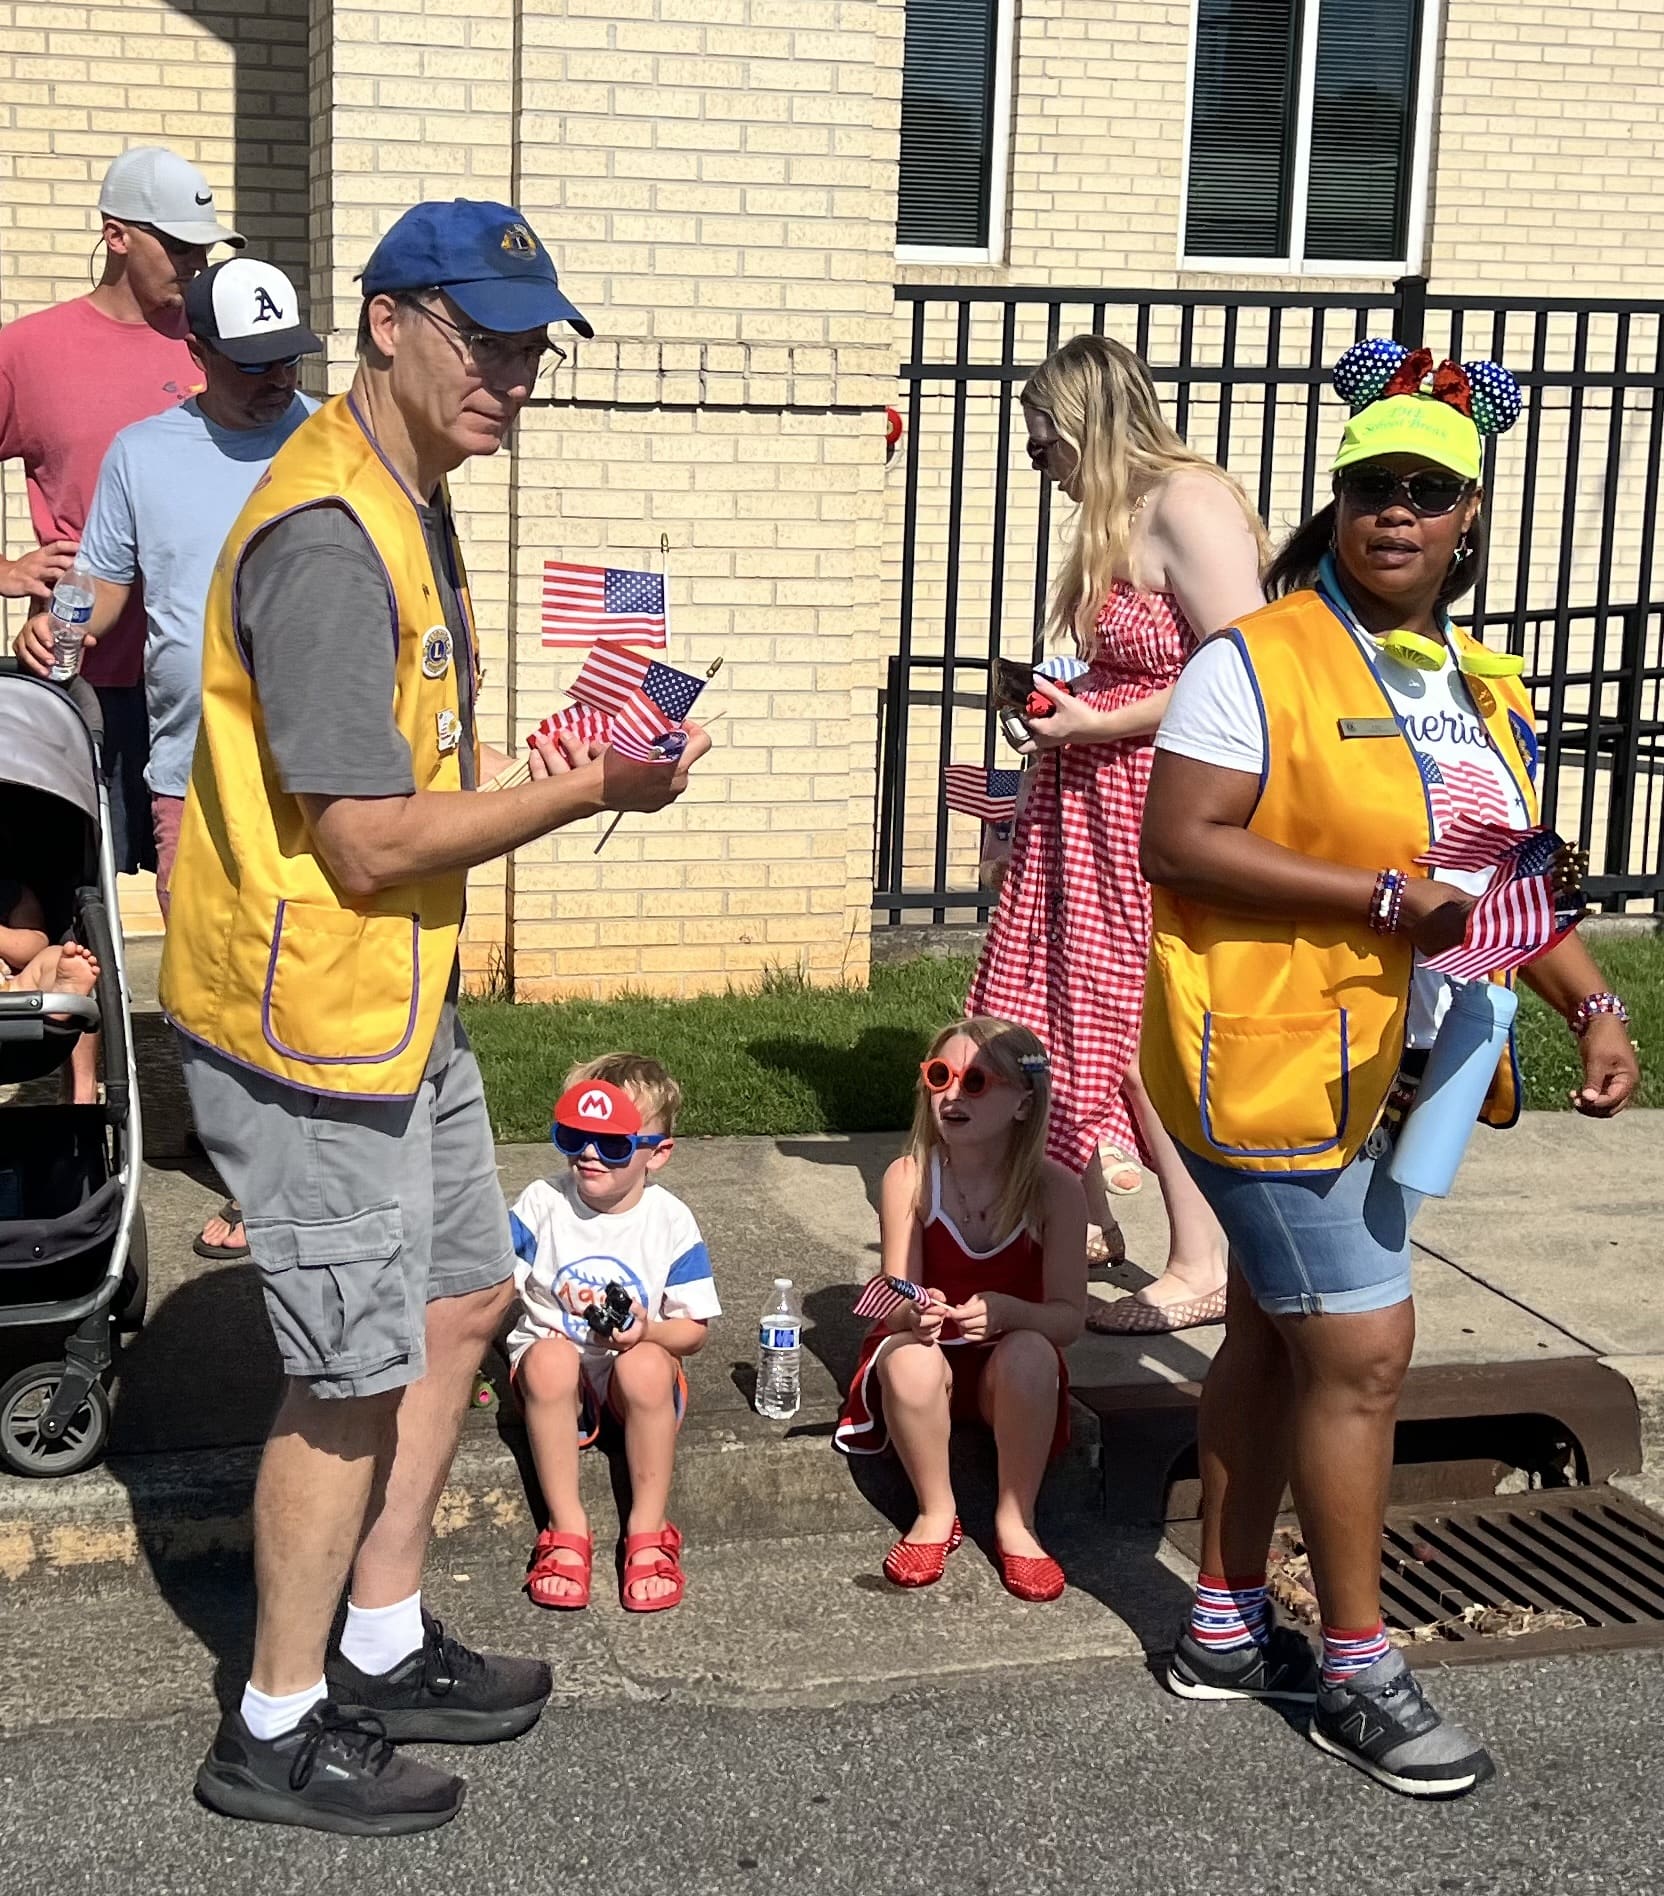
Avid community volunteer Barry Krebs highlighted the Lions Clubs’ distribution of flags at Marietta’s Independence Day parade:
The Cobb County Lions Clubs had a wonderful time handing out approximately 6,000 American flags as they led the City of Marietta 4th of July Parade. After the Lions were done, everyone who wanted a flag had one. It was lots of fun celebrating our nation’s independence with our neighbors. We very much appreciate the Marietta Lions Club and East Cobb Lions Club for making all of the arrangements. Our Lions’ efforts were dedicated to the memory of Steve Hughes.


About the City of Marietta
The City of Marietta is the county seat of Cobb County. The latest estimate from the U.S. Census Bureau puts the population of the city at 63,122 (2024 estimate) which makes it the second largest city in Cobb County by population, smaller only than the City of Mableton.
Marietta’s history dates back to the early 19th century, with significant development occurring alongside the expansion of the Western and Atlantic Railroad in the 1830s.
During the Civil War, Marietta was a strategic location, witnessing several battles and occupations. Post-war, the city experienced growth in various industries, including cotton, flour, paper, and marble mills.
In the 1940s, the establishment of a Bell Aircraft manufacturing plant, later operated by Lockheed, contributed to Marietta’s economic development, especially during the Korean and Vietnam Wars.
Marietta operates under a mayor-council form of government. The current mayor is Steve “Thunder” Tumlin, who has been in office since January 4, 2010.
The City Council comprises seven members, each representing one of the city’s wards:
- Ward 1: Cheryl Richardson
- Ward 2: Griffin L. Chalfant
- Ward 3: Johnny Walker
- Ward 4: G.A. (Andy) Morris
- Ward 5: M. Carlyle Kent
- Ward 6: Andre L. Sims
- Ward 7: Joseph R. Goldstein
This governing body is responsible for enacting local laws, policies, and allocating city resources for various programs and services.
Here are a few quick facts from the Census Bureau
| Population | |
| Population estimates, July 1, 2024, (V2024) | 63,122 |
| Population estimates base, April 1, 2020, (V2024) | 61,055 |
| Population, percent change – April 1, 2020 (estimates base) to July 1, 2024, (V2024) | 3.4% |
| Population, Census, April 1, 2020 | 60,972 |
| Population, Census, April 1, 2010 | 56,579 |
| Age and Sex | |
| Persons under 5 years, percent | 5.7% |
| Persons under 18 years, percent | 20.9% |
| Persons 65 years and over, percent | 14.8% |
| Female persons, percent | 51.7% |
| Race and Hispanic Origin | |
| White alone, percent | 43.7% |
| Black alone, percent (a)(a) | 30.4% |
| American Indian and Alaska Native alone, percent (a)(a) | 1.5% |
| Asian alone, percent (a)(a) | 2.0% |
| Native Hawaiian and Other Pacific Islander alone, percent (a)(a) | 0.0% |
| Two or More Races, percent | 11.4% |
| Hispanic or Latino, percent (b)(b) | 19.8% |
| White alone, not Hispanic or Latino, percent | 41.2% |
| Population Characteristics | |
| Veterans, 2019-2023 | 2,256 |
| Foreign-born persons, percent, 2019-2023 | 18.3% |
| Housing | |
| Housing Units, July 1, 2024, (V2024) | X |
| Owner-occupied housing unit rate, 2019-2023 | 47.2% |
| Median value of owner-occupied housing units, 2019-2023 | $401,100 |
| Median selected monthly owner costs – with a mortgage, 2019-2023 | $2,061 |
| Median selected monthly owner costs -without a mortage, 2019-2023 | $601 |
| Median gross rent, 2019-2023 | $1,491 |
| Building Permits, 2024 | X |
| Families & Living Arrangements | |
| Households, 2019-2023 | 24,574 |
| Persons per household, 2019-2023 | 2.39 |
| Living in the same house 1 year ago, percent of persons age 1 year+ , 2019-2023 | 80.6% |
| Language other than English spoken at home, percent of persons age 5 years+, 2019-2023 | 25.4% |
| Computer and Internet Use | |
| Households with a computer, percent, 2019-2023 | 97.9% |
| Households with a broadband Internet subscription, percent, 2019-2023 | 93.1% |
| Education | |
| High school graduate or higher, percent of persons age 25 years+, 2019-2023 | 89.1% |
| Bachelor’s degree or higher, percent of persons age 25 years+, 2019-2023 | 46.8% |
| Health | |
| With a disability, under age 65 years, percent, 2019-2023 | 6.5% |
| Persons without health insurance, under age 65 years, percent | 20.8% |
| Economy | |
| In civilian labor force, total, percent of population age 16 years+, 2019-2023 | 67.7% |
| In civilian labor force, female, percent of population age 16 years+, 2019-2023 | 61.4% |
| Total accommodation and food services sales, 2022 ($1,000)(c) | 355,423 |
| Total health care and social assistance receipts/revenue, 2022 ($1,000)(c) | 3,634,864 |
| Total transportation and warehousing receipts/revenue, 2022 ($1,000)(c) | 629,700 |
| Total retail sales, 2022 ($1,000)(c) | 2,822,793 |
| Total retail sales per capita, 2022(c) | $45,082 |
| Transportation | |
| Mean travel time to work (minutes), workers age 16 years+, 2019-2023 | 27.5 |
| Income & Poverty | |
| Median households income (in 2023 dollars), 2019-2023 | $70,086 |
| Per capita income in past 12 months (in 2023 dollars), 2019-2023 | $43,074 |
| Persons in poverty, percent | 12.7% |
| Businesses | |
| Total employer establishments, 2022 | X |
| Total employment, 2022 | X |
| Total annual payroll, 2022 ($1,000) | X |
| Total employment, percent change, 2021-2022 | X |
| Total nonemployer establishments, 2023 | X |
| All employer firms, Reference year 2022 | 2,762 |
| Men-owned employer firms, Reference year 2022 | 1,574 |
| Women-owned employer firms, Reference year 2022 | 644 |
| Minority-owned employer firms, Reference year 2022 | 569 |
| Nonminority-owned employer firms, Reference year 2022 | 1,767 |
| Veteran-owned employer firms, Reference year 2022 | 167 |
| Nonveteran-owned employer firms, Reference year 2022 | 2,133 |
| Geography | |
| Population per square mile, 2020 | 2,602.0 |
| Population per square mile, 2010 | 2,451.4 |
| Land area in square miles, 2020 | 23.43 |
| Land area in square miles, 2010 | 23.08 |