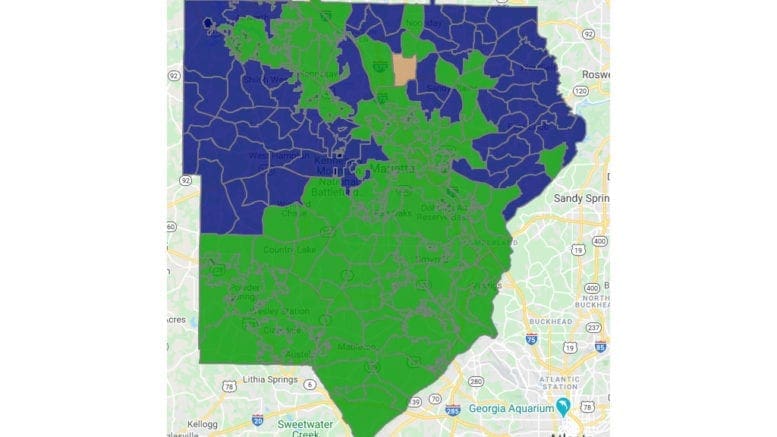
Given the significant political realignments in Cobb County over the past three election cycles it was to be expected that changes in demographics mirrored those changes in the political makeup of the county.
And the numbers released so far in the 2020 census bear that out.
The raw number of Cobb residents identifying as “white alone” dropped by 40,398. or 9.4 percent.
White alone is the category for resident whose only racial self-identification is white, not mixed or Hispanic.
In the 2010 census the number of residents identifying as white-alone stood at 428,023 out of a total population of 688,078.
Now that total number is 387,625 out of a total Cobb population of 766,149.
At this point 50.6 percent of Cobb’s population identifies as while alone, a slim majority. By contrast, in 2010 that percentage stood at 62.2 percent.
Statewide demographic trends among white-alone population
The white-only population of Georgia dropped 4 percent. The overall percentage of Georgia residents identifying as white only dropped from 59.7 percent in 2010 to 51.9 percent in 2020.
Long-term political implications
The political implications of this are significant, and are already evident in the wins of senators Raphael Warnock and Jon Ossoff at the statewide level, and the flip of the Cobb County Board of Commissioners and the Cobb state legislative delegation from Republican to Democratic.
The Republican vote is statistically concentrated among the whites-only population. The Democratic vote is much more varied, with its most consistent voters concentrated in the Black community.
Unless the Republican party makes significant inroads among non-white voters, the political trends are likely to stay in lock-step with the demographic changes in the county and state, to the detriment of the GOP.
Where did these figures come from?
The figures above came from the section on the U.S. Census Bureau website entitled Race and Ethnicity in the United States: 2010 Census and 2020 Census.
The page provides pulldown menus for viewing the figures by national, state, and county levels.

