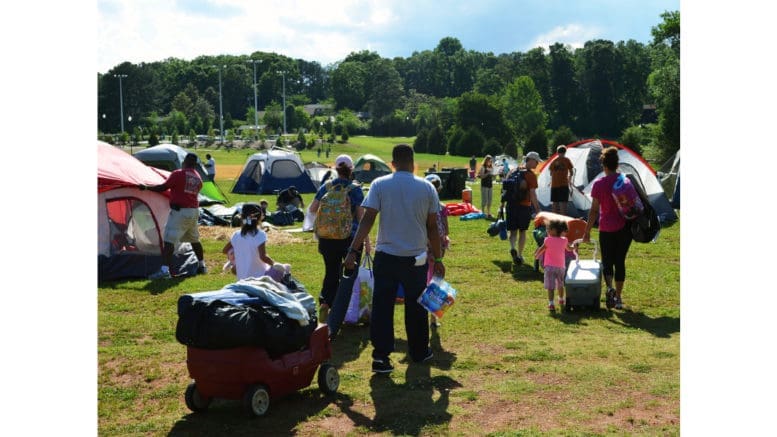
Kennesaw Parks & Recreation, in support of the National Wildlife Federation’s encouragement of outdoor activities by families, announced in the following press release that the annual Backyard Campout will be held on Saturday May 14:
Kennesaw, GA (April 27, 2022) — Kennesaw Parks & Recreation’s annual Backyard Campout is returning to Swift-Cantrell Park on Saturday, May 14! Attendees will enjoy camping under the night sky, along with backyard games, field activities, and campfire entertainment featuring stargazing and s’mores.
The registration fee is $25 per 10’x10’ campsite and includes a hot dog dinner and biscuit breakfast. Participants will need to bring their own tent. A limited number of campsites are available. Advance registration is required.
Register at https://secure.rec1.com/GA/kennesaw-ga/catalog?filter=c2VhcmNoPTE5NDI0NzM
All participants under the age of 17 must be accompanied in their tent by their parent/legal guardian or another family member over the age of 18.
Kennesaw Parks & Rec hosts this event in support of the National Wildlife Federation’s efforts to encourage children and families to experience the outdoors and connect with nature.
For more information, visit kennesaw-ga.gov/parks-and-recreation orcall Kennesaw Parks & Recreation at 770-422-9714.
About the City of Kennesaw
The City of Kennesaw was incorporated in 1887. With a population of 33,036 according to the recent decennial census, Kennesaw is the third-largest city in Cobb County, behind Marietta and Smyrna.
People
| Population | |
|---|---|
| Population, Census, April 1, 2020 | 33,036 |
| Population, Census, April 1, 2010 | 29,783 |
| Age and Sex | |
| Persons under 5 years, percent | 7.4% |
| Persons under 18 years, percent | 23.3% |
| Persons 65 years and over, percent | 10.3% |
| Female persons, percent | 52.2% |
| Race and Hispanic Origin | |
| White alone, percent | 61.7% |
| Black or African American alone, percent(a) | 23.4% |
| American Indian and Alaska Native alone, percent(a) | 0.0% |
| Asian alone, percent(a) | 5.4% |
| Native Hawaiian and Other Pacific Islander alone, percent(a) | 0.1% |
| Two or More Races, percent | 6.5% |
| Hispanic or Latino, percent(b) | 15.9% |
| White alone, not Hispanic or Latino, percent | 52.1% |
| Population Characteristics | |
| Veterans, 2016-2020 | 2,100 |
| Foreign born persons, percent, 2016-2020 | 16.2% |
| Housing | |
| Housing units, July 1, 2019, (V2019) | |
| Owner-occupied housing unit rate, 2016-2020 | 67.5% |
| Median value of owner-occupied housing units, 2016-2020 | $215,800 |
| Median selected monthly owner costs -with a mortgage, 2016-2020 | $1,536 |
| Median selected monthly owner costs -without a mortgage, 2016-2020 | $433 |
| Median gross rent, 2016-2020 | $1,347 |
| Building permits, 2020 | |
| Families & Living Arrangements | |
| Households, 2016-2020 | 13,030 |
| Persons per household, 2016-2020 | 2.62 |
| Living in same house 1 year ago, percent of persons age 1 year+, 2016-2020 | 83.4% |
| Language other than English spoken at home, percent of persons age 5 years+, 2016-2020 | 22.7% |
| Computer and Internet Use | |
| Households with a computer, percent, 2016-2020 | 97.9% |
| Households with a broadband Internet subscription, percent, 2016-2020 | 95.7% |
| Education | |
| High school graduate or higher, percent of persons age 25 years+, 2016-2020 | 93.5% |
| Bachelor’s degree or higher, percent of persons age 25 years+, 2016-2020 | 44.8% |
| Health | |
| With a disability, under age 65 years, percent, 2016-2020 | 5.3% |
| Persons without health insurance, under age 65 years, percent | 14.6% |
| Economy | |
| In civilian labor force, total, percent of population age 16 years+, 2016-2020 | 71.4% |
| In civilian labor force, female, percent of population age 16 years+, 2016-2020 | 66.8% |
| Total accommodation and food services sales, 2012 ($1,000)(c) | 109,733 |
| Total health care and social assistance receipts/revenue, 2012 ($1,000)(c) | 104,760 |
| Total manufacturers shipments, 2012 ($1,000)(c) | 550,659 |
| Total retail sales, 2012 ($1,000)(c) | 840,389 |
| Total retail sales per capita, 2012(c) | $27,118 |
| Transportation | |
| Mean travel time to work (minutes), workers age 16 years+, 2016-2020 | 34.2 |
| Income & Poverty | |
| Median household income (in 2020 dollars), 2016-2020 | $72,972 |
| Per capita income in past 12 months (in 2020 dollars), 2016-2020 | $35,220 |
| Persons in poverty, percent | 12.5% |
Businesses
| Businesses | |
|---|---|
| All firms, 2012 | 3,908 |
| Men-owned firms, 2012 | 1,894 |
| Women-owned firms, 2012 | 1,651 |
| Minority-owned firms, 2012 | 1,337 |
| Nonminority-owned firms, 2012 | 2,384 |
| Veteran-owned firms, 2012 | 341 |
| Nonveteran-owned firms, 2012 | 3,361 |
Geography
| Geography | |
|---|---|
| Population per square mile, 2010 | 3,155.1 |
| Land area in square miles, 2010 | 9.44 |
