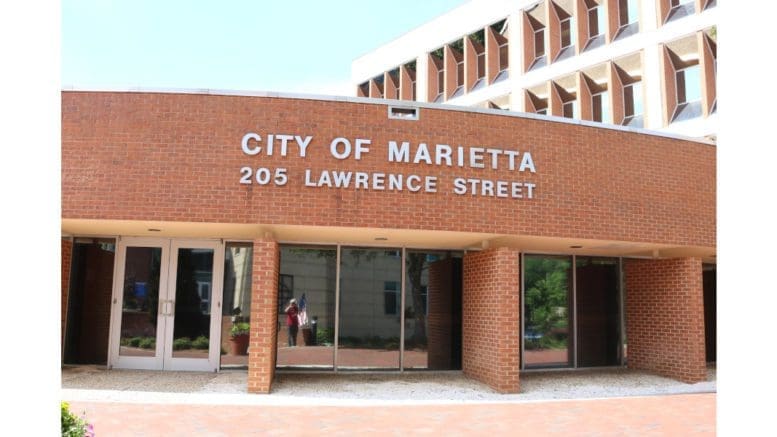
The City of Marietta announced the schedule for its July 4th celebration on Marietta Square, and it includes a concert by the Journey tribute band Departure.
The announcement on the City of Marietta website describes Departure as follows:
In their 14th year together, DEPARTURE is the most respected Journey tribute band in the nation. DEPARTURE replicates the look, sound and feel of the original 80’s rock super group, Journey. These veteran musicians love what they do and have developed an amazing on-stage chemistry. They pride themselves on giving their audience an incredible high-energy, qualitative stage show from start to finish. Dressed in the iconic tuxedo jacket, DEPARTURE lead vocalist, Brian Williams, has an amazing singing voice, flawlessly matching Steve Perry’s vocal range and on-stage movements.
Performing over one hundred shows nationally per year, DEPARTURE brings the very best of Journey to audiences of all ages. DEPARTURE will start performing at 8:00pm & ROCK you into the fireworks show at 9:30pm. 8-top tables are $100 & 6-top tables are $80. To reserve a table or more information, contact Laura McLaughlin at 770-423-1330 or email laura@jrmmanagement.com.
Marietta’s 4th of July celebration schedule:
10:00 am Let Freedom Ring Parade
10:00 am – 9:00 pm Festival – Arts & Crafts, Kid’s Zone, Festival Food, Free Concerts
12:00 pm Concert featuring Scott Thompson
2:00 pm Bell Ringing Ceremony
2:30 pm Concert featuring Atlanta Concert Band
7:00 pm Concert TBD
8:00 pm – 9:30pm Concert featuring DEPARTURE: The Journey Tribute Band
FIREWORKS SHOW AT DARK (9:30ish)
About the City of Marietta
The City of Marietta is the county seat of Cobb County. The latest estimate from the U.S. Census Bureau puts the population of the city at 60,867 which makes it the largest city in Cobb County by population.
However, the city is in a neck-and-neck race with fast-growing Smyrna, whose population was 56,666 at the last estimate.
Here are a few fast facts from the Census Bureau
| Marietta city, Georgia | |
| People | |
| Population, Census, April 1, 2020 | 60972 |
| Population, Census, April 1, 2010 | 56579 |
| Age and Sex | |
| Persons under 5 years, percent | 6.7% |
| Persons under 18 years, percent | 21.8% |
| Persons 65 years and over, percent | 13.2% |
| Female persons, percent | 49.9% |
| Race and Hispanic Origin | |
| White alone, percent | 53.4% |
| Black or African American alone, percent(a) | 32.3% |
| American Indian and Alaska Native alone, percent(a) | 0.6% |
| Asian alone, percent(a) | 1.9% |
| Native Hawaiian and Other Pacific Islander alone, percent(a) | 0.0% |
| Two or More Races, percent | 4.7% |
| Hispanic or Latino, percent(b) | 15.7% |
| White alone, not Hispanic or Latino, percent | 46.4% |
| Population Characteristics | |
| Veterans, 2016-2020 | 2678 |
| Foreign born persons, percent, 2016-2020 | 16.6% |
| Housing | |
| Owner-occupied housing unit rate, 2016-2020 | 44.0% |
| Median value of owner-occupied housing units, 2016-2020 | $310,100 |
| Median selected monthly owner costs -with a mortgage, 2016-2020 | $1,856 |
| Median selected monthly owner costs -without a mortgage, 2016-2020 | $526 |
| Median gross rent, 2016-2020 | $1,145 |
| Families & Living Arrangements | |
| Households, 2016-2020 | 24148 |
| Persons per household, 2016-2020 | 2.39 |
| Living in same house 1 year ago, percent of persons age 1 year+, 2016-2020 | 77.9% |
| Language other than English spoken at home, percent of persons age 5 years+, 2016-2020 | 23.7% |
| Computer and Internet Use | |
| Households with a computer, percent, 2016-2020 | 95.1% |
| Households with a broadband Internet subscription, percent, 2016-2020 | 86.6% |
| Education | |
| High school graduate or higher, percent of persons age 25 years+, 2016-2020 | 88.6% |
| Bachelor’s degree or higher, percent of persons age 25 years+, 2016-2020 | 44.0% |
| Health | |
| With a disability, under age 65 years, percent, 2016-2020 | 6.3% |
| Persons without health insurance, under age 65 years, percent | 20.2% |
| Economy | |
| In civilian labor force, total, percent of population age 16 years+, 2016-2020 | 67.2% |
| In civilian labor force, female, percent of population age 16 years+, 2016-2020 | 61.2% |
| Total accommodation and food services sales, 2012 ($1,000)(c) | 264544 |
| Total health care and social assistance receipts/revenue, 2012 ($1,000)(c) | 1584232 |
| Total manufacturers shipments, 2012 ($1,000)(c) | 1129407 |
| Total retail sales, 2012 ($1,000)(c) | 1976915 |
| Total retail sales per capita, 2012(c) | $33,875 |
| Transportation | |
| Mean travel time to work (minutes), workers age 16 years+, 2016-2020 | 28.5 |
| Income & Poverty | |
| Median household income (in 2020 dollars), 2016-2020 | $59,594 |
| Per capita income in past 12 months (in 2020 dollars), 2016-2020 | $36,112 |
| Persons in poverty, percent | 14.1% |
| Businesses | |
| All firms, 2012 | 10501 |
| Men-owned firms, 2012 | 4934 |
| Women-owned firms, 2012 | 4186 |
| Minority-owned firms, 2012 | 4286 |
| Nonminority-owned firms, 2012 | 5502 |
| Veteran-owned firms, 2012 | 1015 |
| Nonveteran-owned firms, 2012 | 8663 |
| Geography | |
| Population per square mile, 2010 | 2451.4 |
| Land area in square miles, 2010 | 23.08 |
