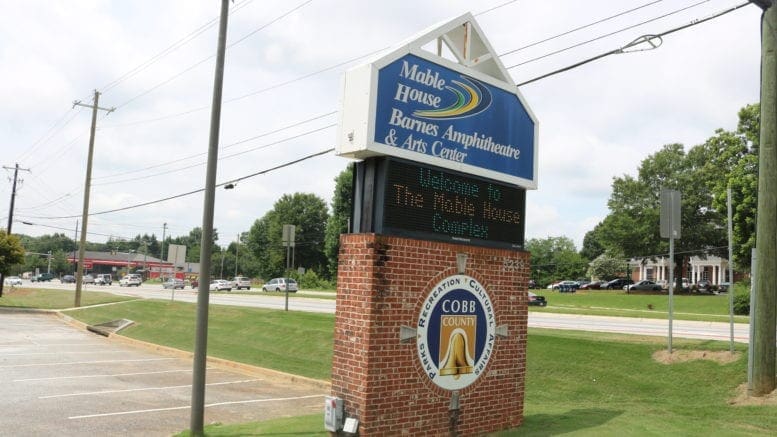
Cobb County government published the following schedule of summer concerts at the Mable House Barnes Amphitheatre, located at 5239 Floyd Rd SW, Mableton, GA 30126:
Grab tickets to amazing concerts at Cobb’s Mable House Barnes Amphitheatre. Dine at outdoor tables, or sit theater-style and on the lawn. Bring in food for a festive picnic or buy concessions on site. These are some of the upcoming shows:
June 18, 7 p.m. – Wade Ford Concert Series: Gregory Porter, Marion Meadows, Alex Bugnon
Purchase tickets hereJune 25, 7 p.m. – Taylor Dayne
Purchase tickets hereJune 26, 7 p.m. – Wade Ford Concert Series: Brian Culbertson, Gerald Albright
Purchase tickets hereJuly 1,7 p.m
2022 Nothin But Soul Tour – Van Fields Stylistics “Revue”/ The Dells “Revue”
Purchase tickets here.July 02, 7 p.m.
Wade Ford Concert Series:
Rakim, KRS-One, Big Daddy Kane, Slick Rick, Chubb Rock
Purchase tickets here.Sun, July 03, 7 p.m.
Wade Ford Concert Series
Rakim, KRS-One, Big Daddy Kane, Slick Rick, Chubb Rock
Purchase tickets hereAug. 21
WAR and the Ohio Players, which had been postponed, has been rescheduled for Aug. 21.
About Mableton
Mableton is a Census Designated Place in Cobb County, Georgia. A CDP is an area that is not incorporated, but that has enough historical identity that the census keeps records on it by name.
The U.S. Census Bureau give the following quick facts about Mableton CDP:
| Median household income (in 2020 dollars), 2016-2020 | $68,777 |
People
| Population | |
|---|---|
| Population, Census, April 1, 2020 | 40,834 |
| Population, Census, April 1, 2010 | 37,115 |
| Age and Sex | |
| Persons under 5 years, percent | 8.3% |
| Persons under 18 years, percent | 24.9% |
| Persons 65 years and over, percent | 11.6% |
| Female persons, percent | 51.9% |
| Race and Hispanic Origin | |
| White alone, percent | 46.2% |
| Black or African American alone, percent(a) | 41.4% |
| American Indian and Alaska Native alone, percent(a) | 0.1% |
| Asian alone, percent(a) | 2.5% |
| Native Hawaiian and Other Pacific Islander alone, percent(a) | 0.0% |
| Two or More Races, percent | 3.6% |
| Hispanic or Latino, percent(b) | 21.1% |
| White alone, not Hispanic or Latino, percent | 33.5% |
| Population Characteristics | |
| Veterans, 2016-2020 | 2,390 |
| Foreign born persons, percent, 2016-2020 | 16.0% |
| Housing | |
| Housing units, July 1, 2021, (V2021) | |
| Owner-occupied housing unit rate, 2016-2020 | 72.2% |
| Median value of owner-occupied housing units, 2016-2020 | $210,600 |
| Median selected monthly owner costs -with a mortgage, 2016-2020 | $1,465 |
| Median selected monthly owner costs -without a mortgage, 2016-2020 | $388 |
| Median gross rent, 2016-2020 | $1,187 |
| Building permits, 2021 | |
| Families & Living Arrangements | |
| Households, 2016-2020 | 15,080 |
| Persons per household, 2016-2020 | 2.76 |
| Living in same house 1 year ago, percent of persons age 1 year+, 2016-2020 | 90.0% |
| Language other than English spoken at home, percent of persons age 5 years+, 2016-2020 | 25.3% |
| Computer and Internet Use | |
| Households with a computer, percent, 2016-2020 | 96.8% |
| Households with a broadband Internet subscription, percent, 2016-2020 | 91.3% |
| Education | |
| High school graduate or higher, percent of persons age 25 years+, 2016-2020 | 87.7% |
| Bachelor’s degree or higher, percent of persons age 25 years+, 2016-2020 | 37.8% |
| Health | |
| With a disability, under age 65 years, percent, 2016-2020 | 7.4% |
| Persons without health insurance, under age 65 years, percent | 14.5% |
| Economy | |
| In civilian labor force, total, percent of population age 16 years+, 2016-2020 | 70.9% |
| In civilian labor force, female, percent of population age 16 years+, 2016-2020 | 64.3% |
| Total accommodation and food services sales, 2012 ($1,000)(c) | D |
| Total health care and social assistance receipts/revenue, 2012 ($1,000)(c) | 22,339 |
| Total manufacturers shipments, 2012 ($1,000)(c) | 52,068 |
| Total retail sales, 2012 ($1,000)(c) | 272,978 |
| Total retail sales per capita, 2012(c) | NA |
| Transportation | |
| Mean travel time to work (minutes), workers age 16 years+, 2016-2020 | 32.4 |
| Income & Poverty | |
| Median household income (in 2020 dollars), 2016-2020 | $68,777 |
| Per capita income in past 12 months (in 2020 dollars), 2016-2020 | $34,935 |
| Persons in poverty, percent | 8.9% |
Businesses
| Businesses | |
|---|---|
| All firms, 2012 | 4,308 |
| Men-owned firms, 2012 | 2,168 |
| Women-owned firms, 2012 | 1,765 |
| Minority-owned firms, 2012 | 2,799 |
| Nonminority-owned firms, 2012 | 1,363 |
| Veteran-owned firms, 2012 | 308 |
| Nonveteran-owned firms, 2012 | 3,834 |
Geography
| Geography | |
|---|---|
| Population per square mile, 2010 | 1,804.5 |
| Land area in square miles, 2010 | 20.57 |