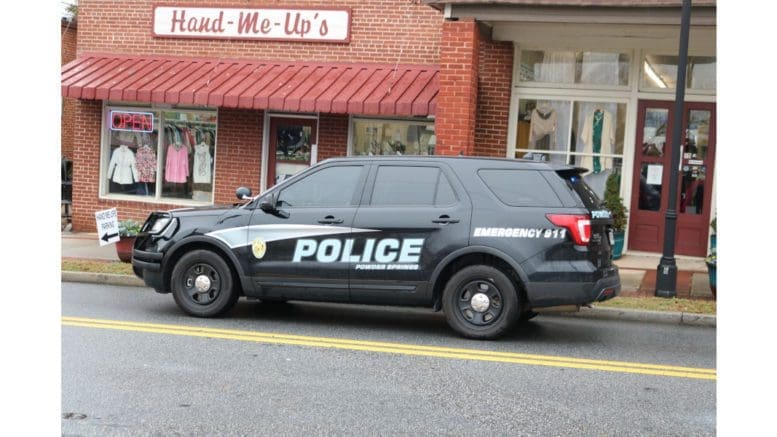
The Powder Springs Police Department announced in a public information release that around 12:31 a.m. this morning police received a call that a home invasion and armed robbery took place on Silvery Way in the City of Powder Springs.
The victim told the responding officers that a male used a pry bar to gain entry to the house, robbed him at gunpoint, and fled in a dark-colored sedan driven by a second suspect.
Powder Springs police were able to obtain a tag number and alerted surrounding agencies.
The Cobb County Police Department saw the vehicle on the East West Connector. Police pursued and the chase entered the City of Atlanta. One of the suspects left the vehicle when it briefly stopped and was detained. The other suspect fled on foot at a different location in the City of Atlanta and is still being sought.
Anyone with information is asked to call Captain Holcombe with the Powder Springs Police Department Criminal Investigations Division at 770-943-1616.
About the City of Powder Springs
The City of Powder Springs was incorporated in September of 1883.
The City Councils is as follows:
| Mayor | Al Thurman |
| Councilman Ward 1 and Mayor Pro Tem | Henry Lust |
| Councilwoman Ward 2 | Doris Dawkins |
| Councilman Ward 3 | Dwayne Green |
| Councilman Post 1 At Large | Patrick Bordelon |
| Councilwoman Post 2 At Large | Patricia Wisdom |
The U.S. Census Bureau gives the following quick facts about the City of Powder Springs:
| Population | |
| Population Estimates, July 1 2021, (V2021) | 17,083 |
| Population estimates base, April 1, 2020, (V2021) | 16,901 |
| Population, percent change – April 1, 2020 (estimates base) to July 1, 2021, (V2021) | 1.1% |
| Population, Census, April 1, 2020 | 16,887 |
| Population, Census, April 1, 2010 | 13,940 |
| Age and Sex | |
| Persons under 5 years, percent | 6.6% |
| Persons under 18 years, percent | 24.3% |
| Persons 65 years and over, percent | 14.6% |
| Female persons, percent | 56.8% |
| Race and Hispanic Origin | |
| White alone, percent | 34.2% |
| Black or African American alone, percent(a) | 56.0% |
| American Indian and Alaska Native alone, percent(a) | 1.3% |
| Asian alone, percent(a) | 1.5% |
| Native Hawaiian and Other Pacific Islander alone, percent(a) | 0.0% |
| Two or More Races, percent | 2.9% |
| Hispanic or Latino, percent(b) | 14.7% |
| White alone, not Hispanic or Latino, percent | 29.5% |
| Population Characteristics | |
| Veterans, 2016-2020 | 1,356 |
| Foreign born persons, percent, 2016-2020 | 9.6% |
| Housing | |
| Housing units, July 1, 2021, (V2021) | X |
| Owner-occupied housing unit rate, 2016-2020 | 80.1% |
| Median value of owner-occupied housing units, 2016-2020 | $181,000 |
| Median selected monthly owner costs -with a mortgage, 2016-2020 | $1,328 |
| Median selected monthly owner costs -without a mortgage, 2016-2020 | $453 |
| Median gross rent, 2016-2020 | $1,296 |
| Building permits, 2021 | X |
| Families & Living Arrangements | |
| Households, 2016-2020 | 5,570 |
| Persons per household, 2016-2020 | 2.72 |
| Living in same house 1 year ago, percent of persons age 1 year+, 2016-2020 | 89.1% |
| Language other than English spoken at home, percent of persons age 5 years+, 2016-2020 | 15.2% |
| Computer and Internet Use | |
| Households with a computer, percent, 2016-2020 | 94.6% |
| Households with a broadband Internet subscription, percent, 2016-2020 | 91.1% |
| Education | |
| High school graduate or higher, percent of persons age 25 years+, 2016-2020 | 94.1% |
| Bachelor’s degree or higher, percent of persons age 25 years+, 2016-2020 | 39.4% |
| Health | |
| With a disability, under age 65 years, percent, 2016-2020 | 8.6% |
| Persons without health insurance, under age 65 years, percent | 9.4% |
| Economy | |
| In civilian labor force, total, percent of population age 16 years+, 2016-2020 | 67.6% |
| In civilian labor force, female, percent of population age 16 years+, 2016-2020 | 63.5% |
| Total accommodation and food services sales, 2017 ($1,000)(c) | 29,526 |
| Total health care and social assistance receipts/revenue, 2017 ($1,000)(c) | 39,184 |
| Total transportation and warehousing receipts/revenue, 2017 ($1,000)(c) | 7,540 |
| Total retail sales, 2017 ($1,000)(c) | 181,543 |
| Total retail sales per capita, 2017(c) | $12,102 |
| Transportation | |
| Mean travel time to work (minutes), workers age 16 years+, 2016-2020 | 37.6 |
| Income & Poverty | |
| Median household income (in 2020 dollars), 2016-2020 | $72,810 |
| Per capita income in past 12 months (in 2020 dollars), 2016-2020 | $32,601 |
| Persons in poverty, percent | 6.3% |
| Businesses | |
| Total employer establishments, 2020 | X |
| Total employment, 2020 | X |
| Total annual payroll, 2020 ($1,000) | X |
| Total employment, percent change, 2019-2020 | X |
| Total nonemployer establishments, 2019 | X |
| All employer firms, Reference year 2017 | 300 |
| Men-owned employer firms, Reference year 2017 | 134 |
| Women-owned employer firms, Reference year 2017 | S |
| Minority-owned employer firms, Reference year 2017 | S |
| Nonminority-owned employer firms, Reference year 2017 | 170 |
| Veteran-owned employer firms, Reference year 2017 | S |
| Nonveteran-owned employer firms, Reference year 2017 | 247 |
| Geography | |
| Population per square mile, 2020 | 2,288.5 |
| Population per square mile, 2010 | 1,944.7 |
| Land area in square miles, 2020 | 7.38 |
| Land area in square miles, 2010 | 7.17 |
