The National Weather Service forecasts sunny skies here in Cobb County on Friday October 7 with a high near 81. Tonight it should be partly cloudy with an overnight low of about 52 degrees.
What does the extended forecast have in store?
This forecast is centered on Dobbins Air Reserve Base in Marietta.
Today
Sunny, with a high near 81. Light northwest wind increasing to 5 to 10 mph in the afternoon.
Tonight
Partly cloudy, with a low around 52. Northwest wind around 5 mph.
Saturday
Sunny, with a high near 73. Northwest wind 5 to 10 mph, with gusts as high as 20 mph.
Saturday Night
Clear, with a low around 45. North wind 5 to 10 mph.
Sunday
Sunny, with a high near 73. North wind around 5 mph.
Sunday Night
Clear, with a low around 47.
Columbus Day
Sunny, with a high near 77.
Monday Night
Mostly clear, with a low around 52.
Tuesday
Sunny, with a high near 79.
Tuesday Night
Mostly clear, with a low around 54.
Wednesday
Sunny, with a high near 79.
Wednesday Night
A 20 percent chance of showers. Mostly clear, with a low around 56.
Thursday
A 30 percent chance of showers and thunderstorms. Mostly sunny, with a high near 77.
What was the climate like in the latest reporting period?
The NWS climate summary for metro Atlanta has now been updated with August figures.
In an article entitled What is the Difference between Climate and Weather?, the National Ocean Service describes the difference as follows:
Weather is what you see outside on any particular day. So, for example, it may be 75° degrees and sunny or it could be 20° degrees with heavy snow. That’s the weather.
Climate is the average of that weather. For example, you can expect snow in the Northeast in January or for it to be hot and humid in the Southeast in July. This is climate. The climate record also includes extreme values such as record high temperatures or record amounts of rainfall. If you’ve ever heard your local weather person say “today we hit a record high for this day,” she is talking about climate records.
So when we are talking about climate change, we are talking about changes in long-term averages of daily weather. In most places, weather can change from minute-to-minute, hour-to-hour, day-to-day, and season-to-season. Climate, however, is the average of weather over time and space.
The climate report for the Atlanta area for the previous month shows how much departure from the average temperatures that month represents. The average temperature for a date is the average over a 30-year period.
| Date | High | Low | Average | Departure from norm | Precipitation |
| 2022-08-01 | 85 | 73 | 79 | -2.2 | T |
| 2022-08-02 | 92 | 73 | 82.5 | 1.4 | 0 |
| 2022-08-03 | 90 | 74 | 82 | 0.9 | 0.01 |
| 2022-08-04 | 91 | 70 | 80.5 | -0.6 | 0.56 |
| 2022-08-05 | 91 | 73 | 82 | 1 | 0.19 |
| 2022-08-06 | 91 | 72 | 81.5 | 0.5 | 1.2 |
| 2022-08-07 | 90 | 71 | 80.5 | -0.4 | 0 |
| 2022-08-08 | 91 | 72 | 81.5 | 0.6 | T |
| 2022-08-09 | 90 | 72 | 81 | 0.2 | 1.19 |
| 2022-08-10 | 85 | 71 | 78 | -2.8 | 0.86 |
| 2022-08-11 | 87 | 71 | 79 | -1.7 | 0.46 |
| 2022-08-12 | 89 | 72 | 80.5 | -0.1 | 0.01 |
| 2022-08-13 | 84 | 71 | 77.5 | -3.1 | 0 |
| 2022-08-14 | 89 | 70 | 79.5 | -1 | 0 |
| 2022-08-15 | 91 | 73 | 82 | 1.6 | 0.13 |
| 2022-08-16 | 88 | 71 | 79.5 | -0.8 | 0 |
| 2022-08-17 | 82 | 67 | 74.5 | -5.7 | 0.73 |
| 2022-08-18 | 81 | 68 | 74.5 | -5.7 | T |
| 2022-08-19 | 78 | 72 | 75 | -5.1 | 0.21 |
| 2022-08-20 | 86 | 71 | 78.5 | -1.5 | 0.04 |
| 2022-08-21 | 86 | 70 | 78 | -1.8 | 0.01 |
| 2022-08-22 | 83 | 73 | 78 | -1.7 | T |
| 2022-08-23 | 87 | 72 | 79.5 | -0.1 | 0 |
| 2022-08-24 | 84 | 72 | 78 | -1.5 | 0.19 |
| 2022-08-25 | 83 | 70 | 76.5 | -2.9 | 0.59 |
| 2022-08-26 | 88 | 72 | 80 | 0.8 | 0.13 |
| 2022-08-27 | 90 | 73 | 81.5 | 2.4 | T |
| 2022-08-28 | 89 | 73 | 81 | 2 | 0 |
| 2022-08-29 | 90 | 73 | 81.5 | 2.7 | 0 |
| 2022-08-30 | 91 | 72 | 81.5 | 2.8 | 0.28 |
| 2022-08-31 | 89 | 72 | 80.5 | 2 | 0 |
| Sum | 2711 | 2219 | |||
| Average | 87.5 | 71.6 | 79.5 | -0.7 | |
| Normal | 89 | 71.3 | 80.2 |
| Summer 2022 Average Temperature Ranking & Records | |||
| Climate Site | Avg Temp Rank | Highest Avg Temp Record (deg) (year) | Lowest Avg Temp Record (deg) (year) |
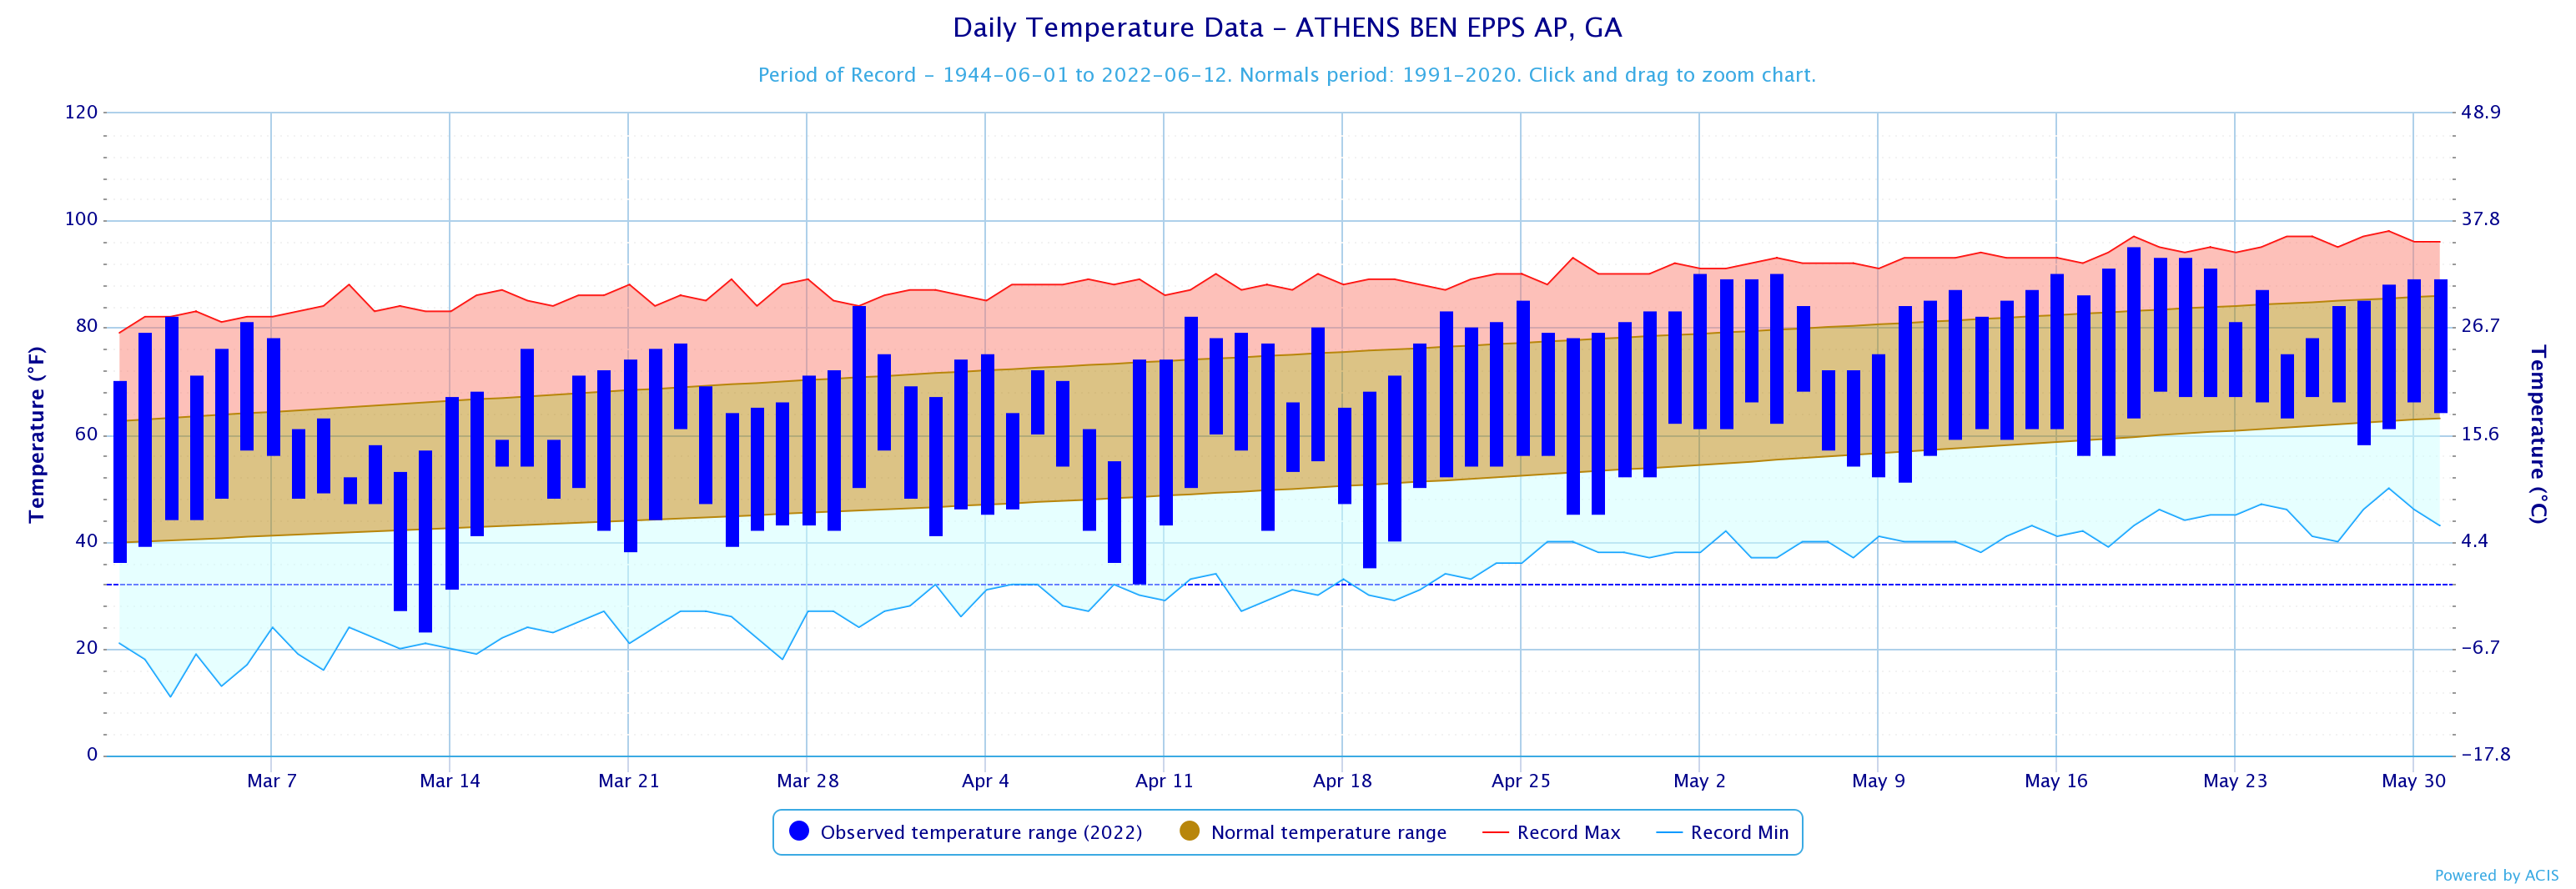
| Athens | 12th Warmest | 82.2 (2016) | 74.5 (1967) |
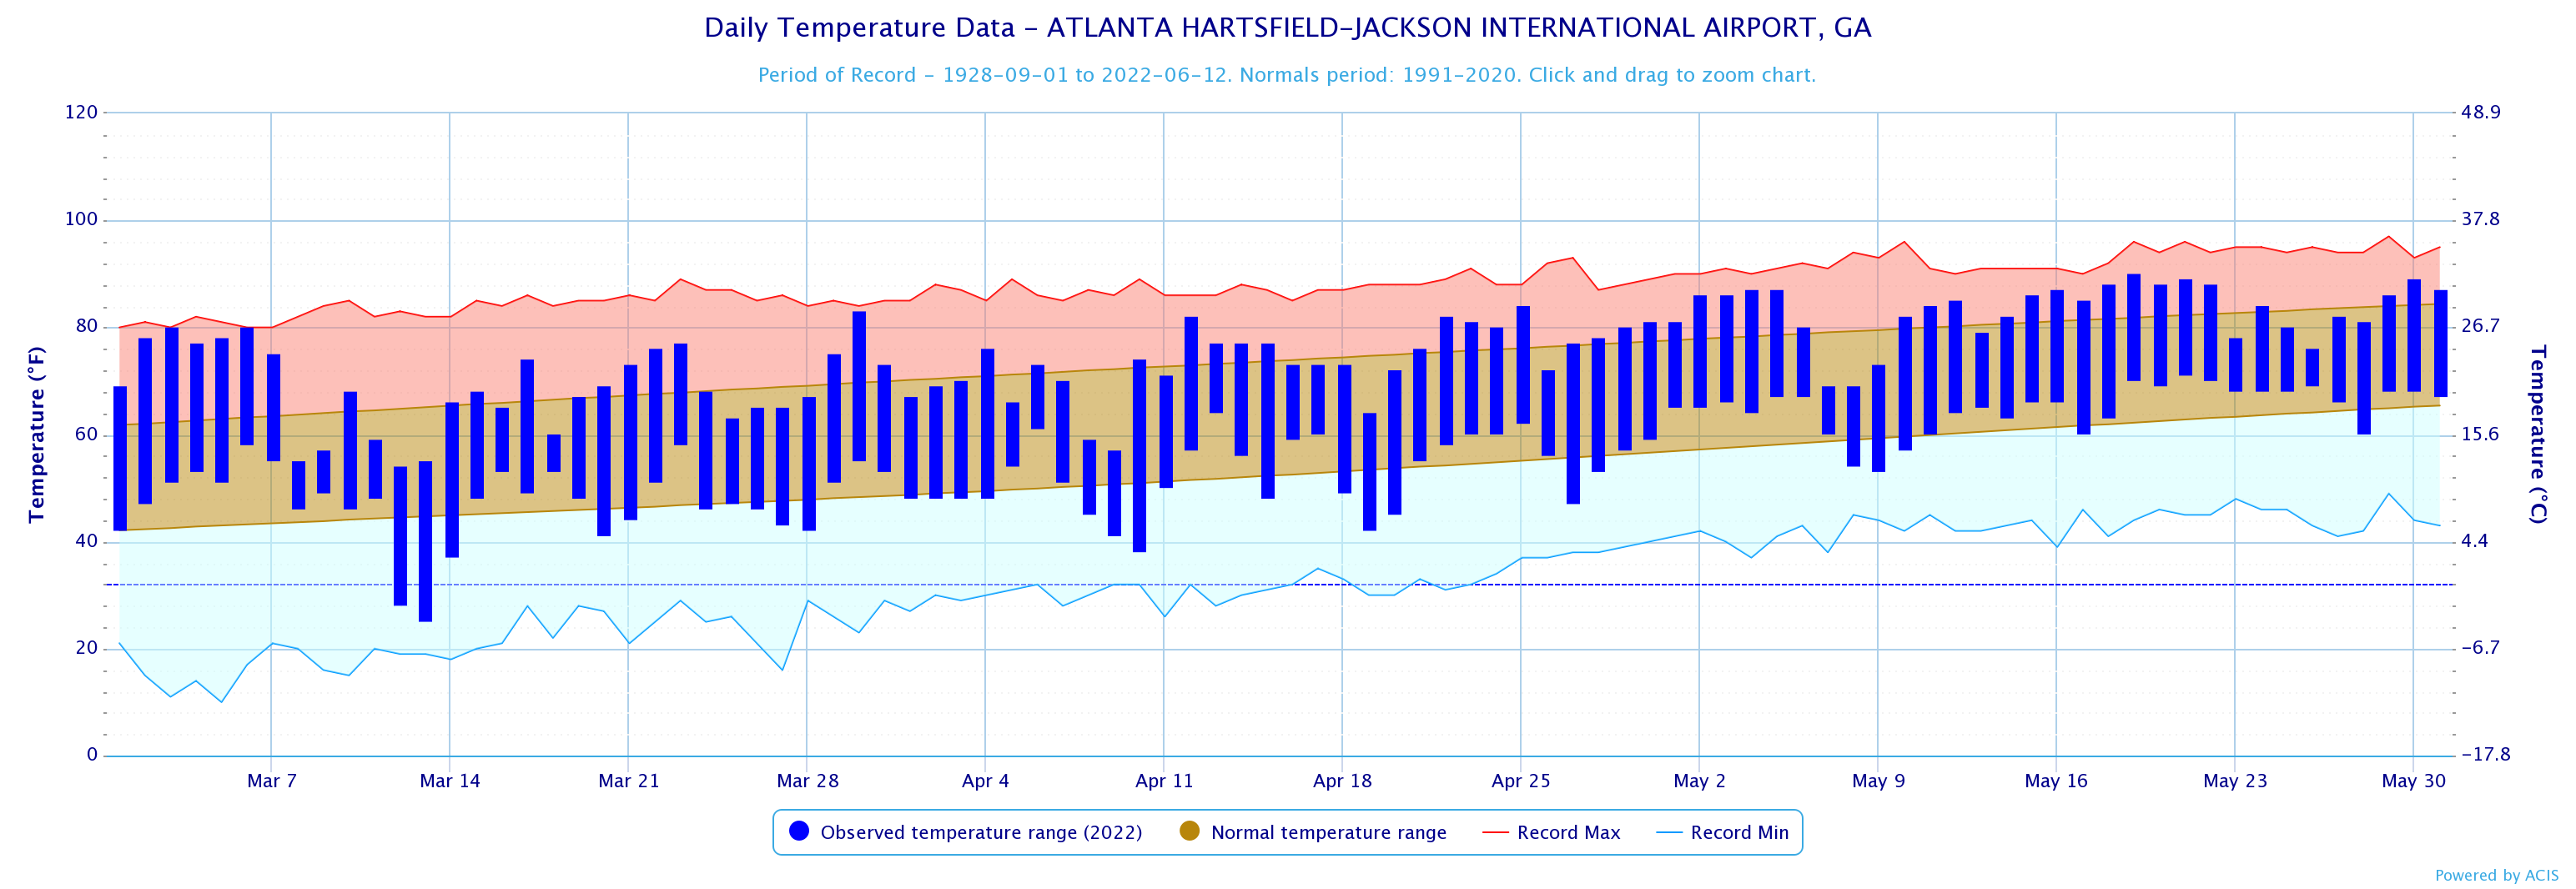
| Atlanta | 10th Warmest | 82.7 (1980) | 73.5 (1967) |
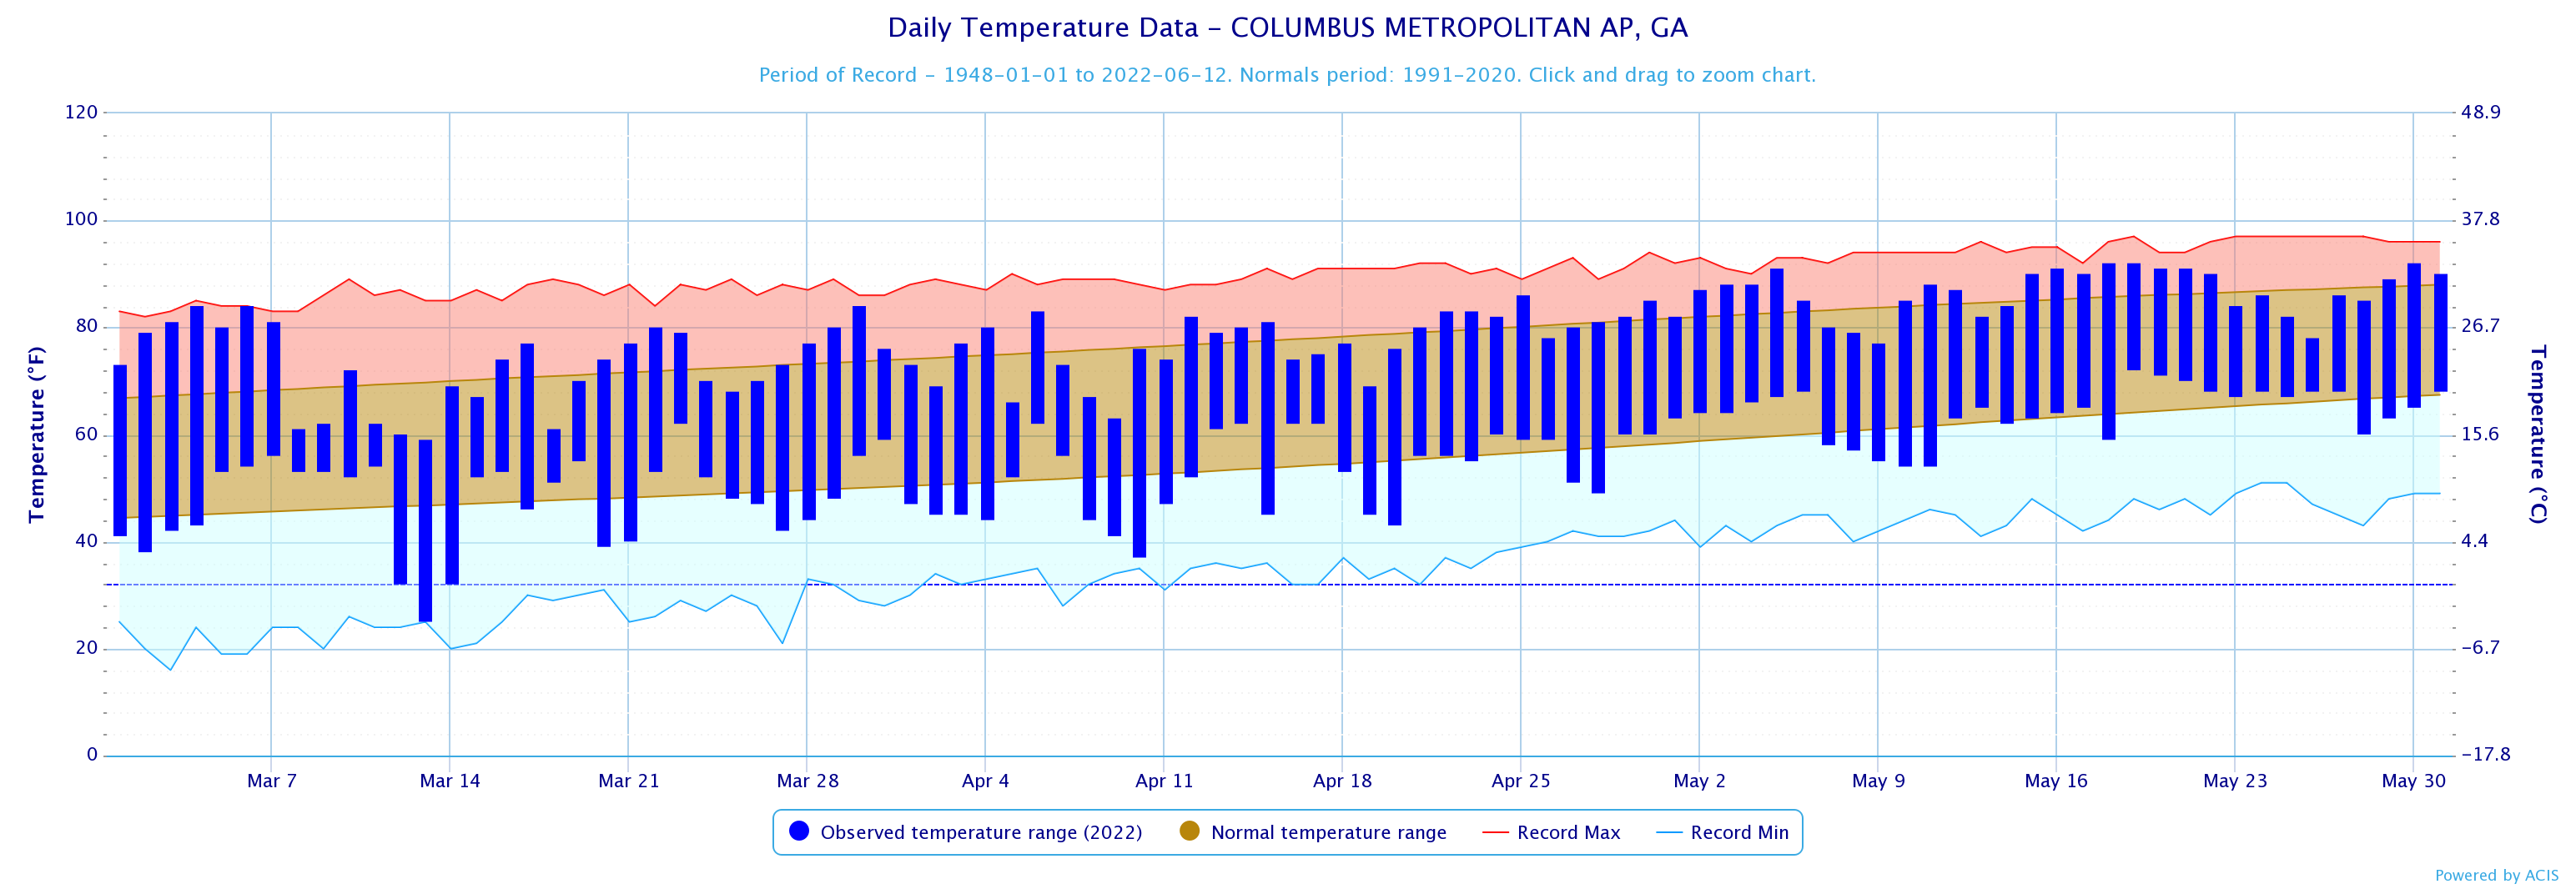
| Columbus | 15th Warmest | 84.6 (2011) | 78.3 (1967) |
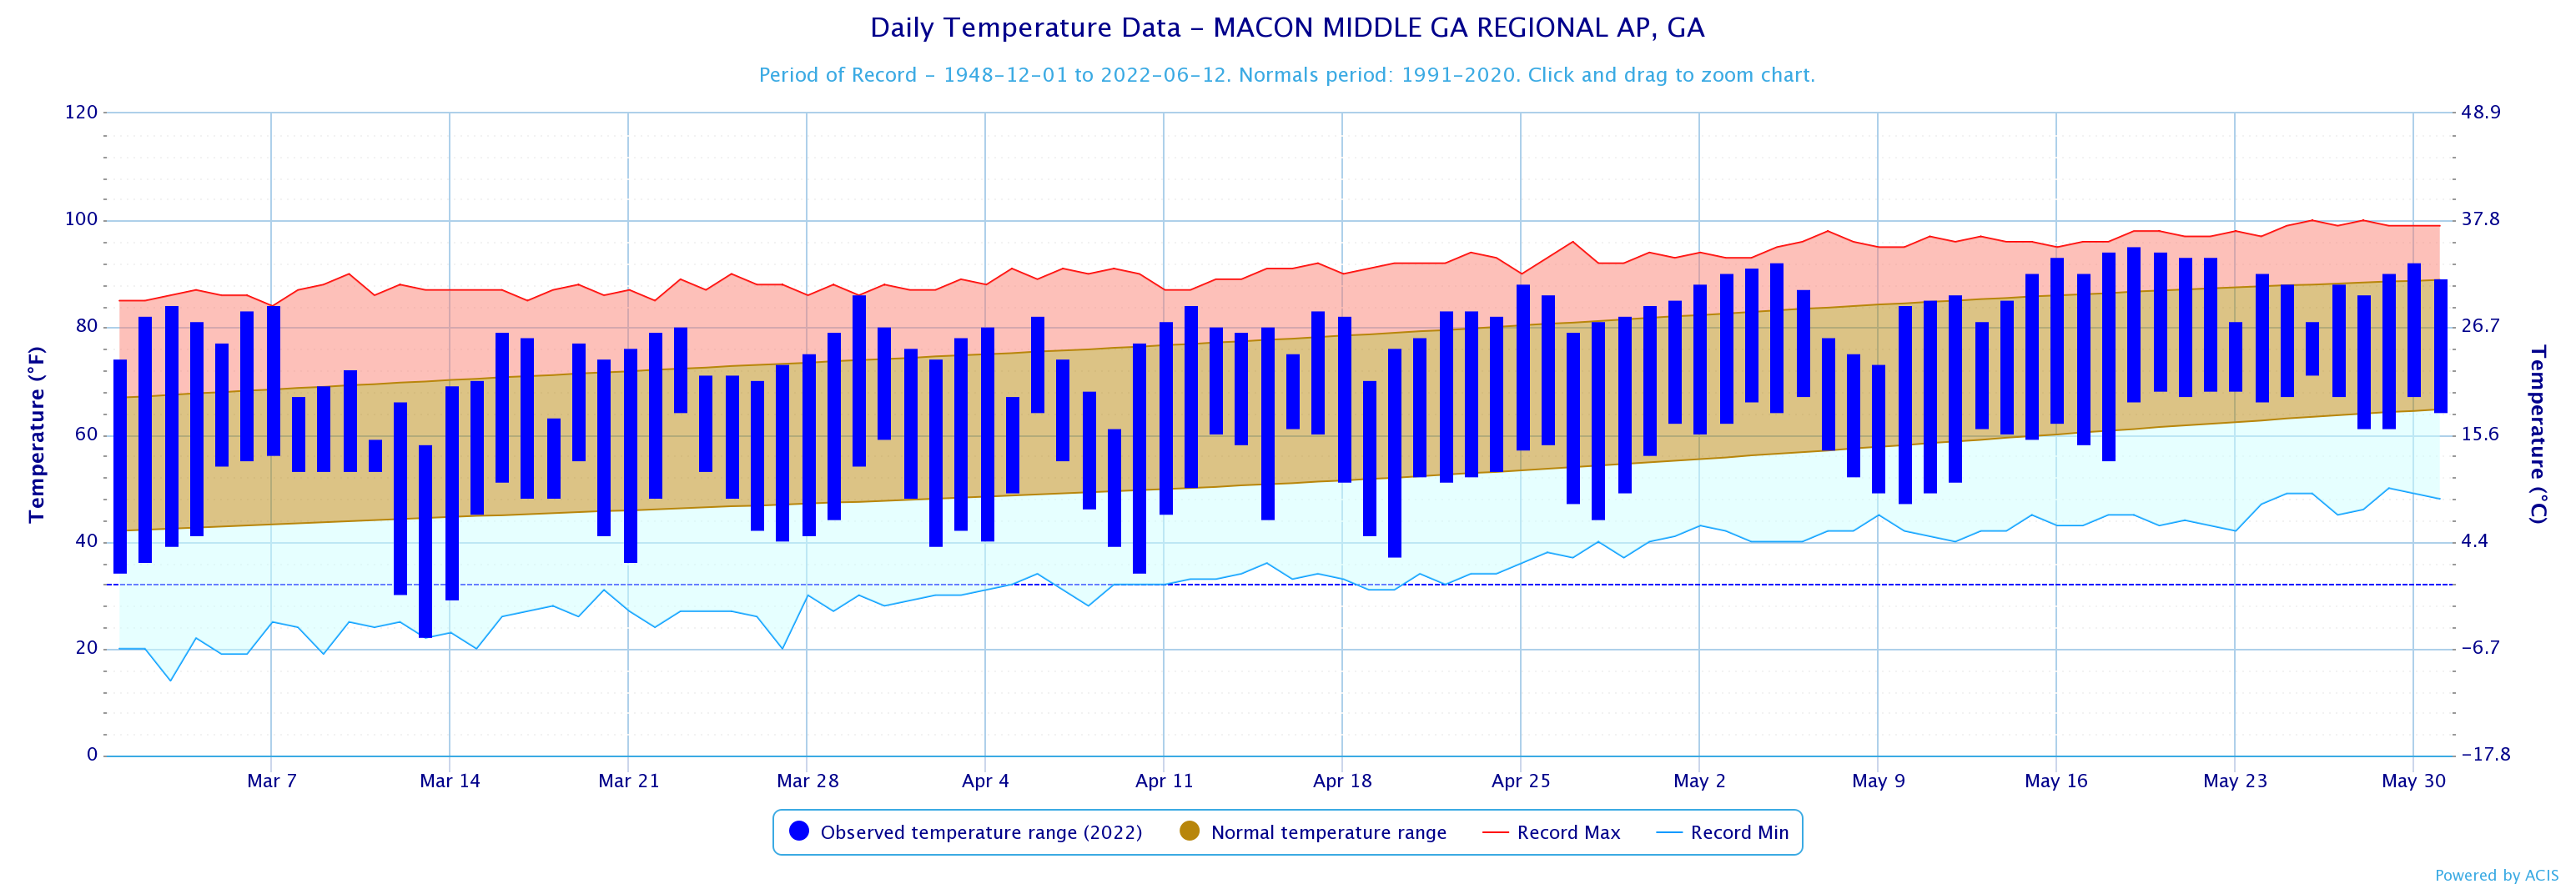
| Macon | 14th Warmest | 83.5 (1954) | 76.1 (1967) |
| Summer 2022 Temperature Climate Statistics | ||||
| Climate Site | Maximum Temperature (deg) | Max T Date | Minimum Temperature (deg) | Min T Date |
| Athens | 102 | 6/22 | 59 | 6/20 |
| Atlanta | 99 | 6/15 | 64 | 6/10 |
| Columbus | 102 | 6/22 | 60 | 6/20 |
| Macon | 105 | 6/22 | 60 | 6/20 |
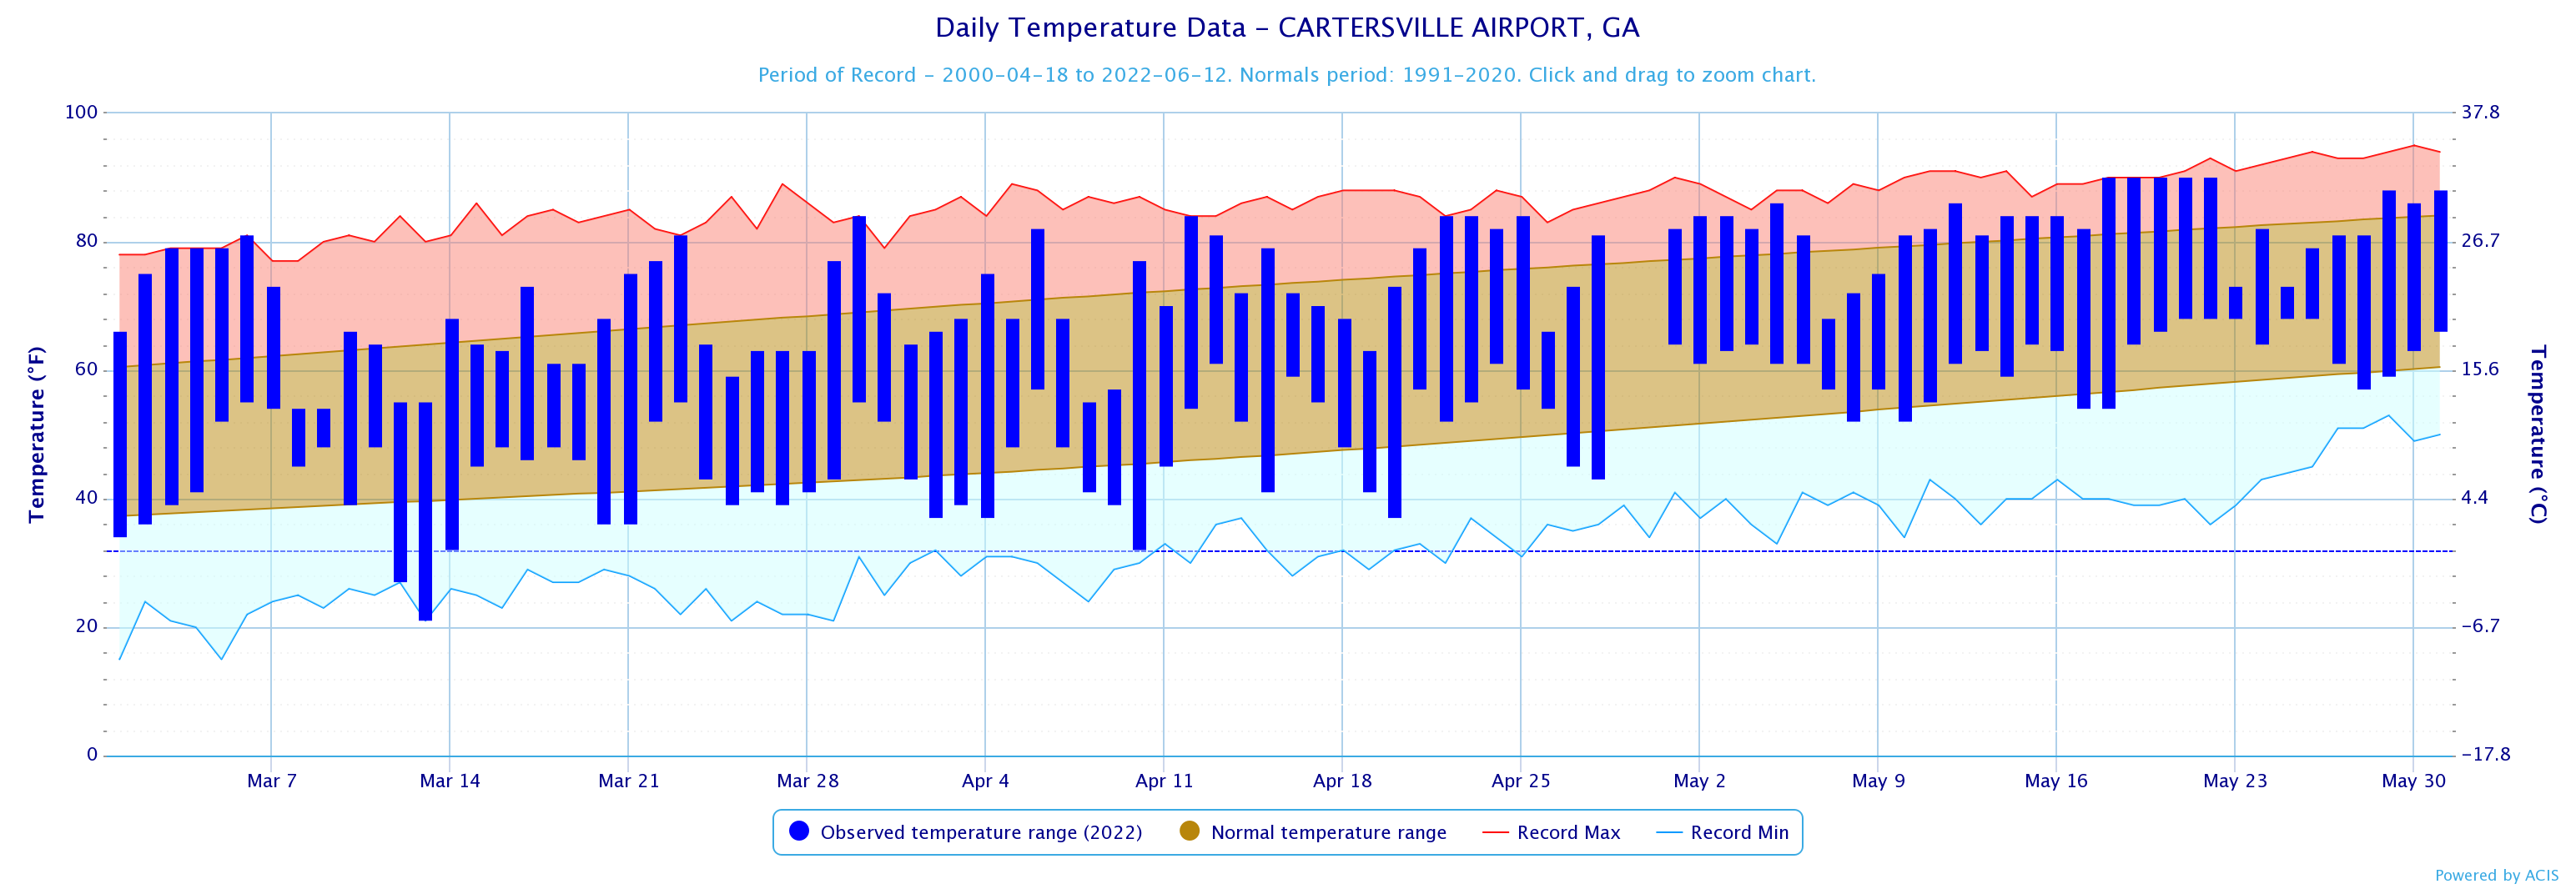
| Cartersville | 97 | 6/22, 23 | 57 | 6/20 |
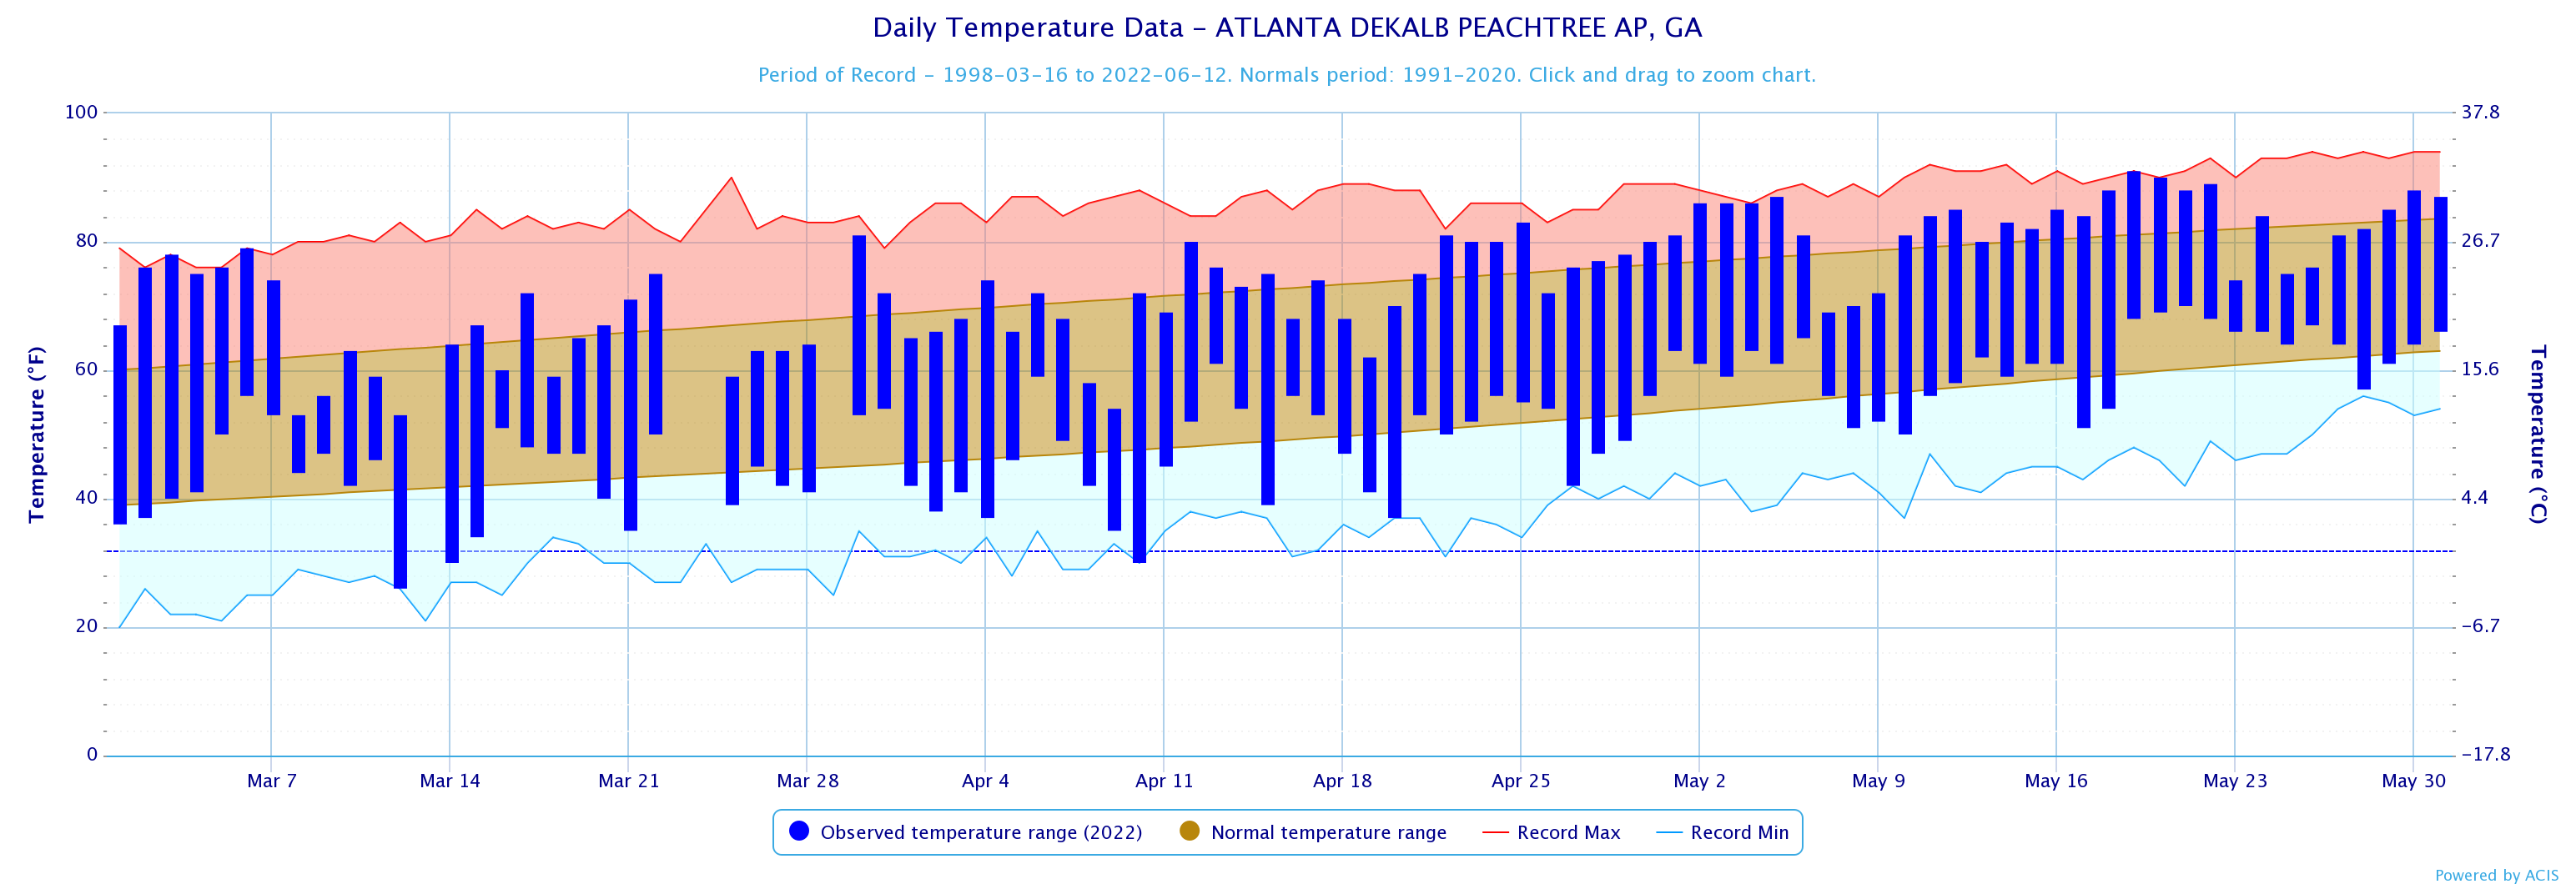
| Dekalb Peachtree Arpt | 100 | 6/15 | 58 | 6/20 |
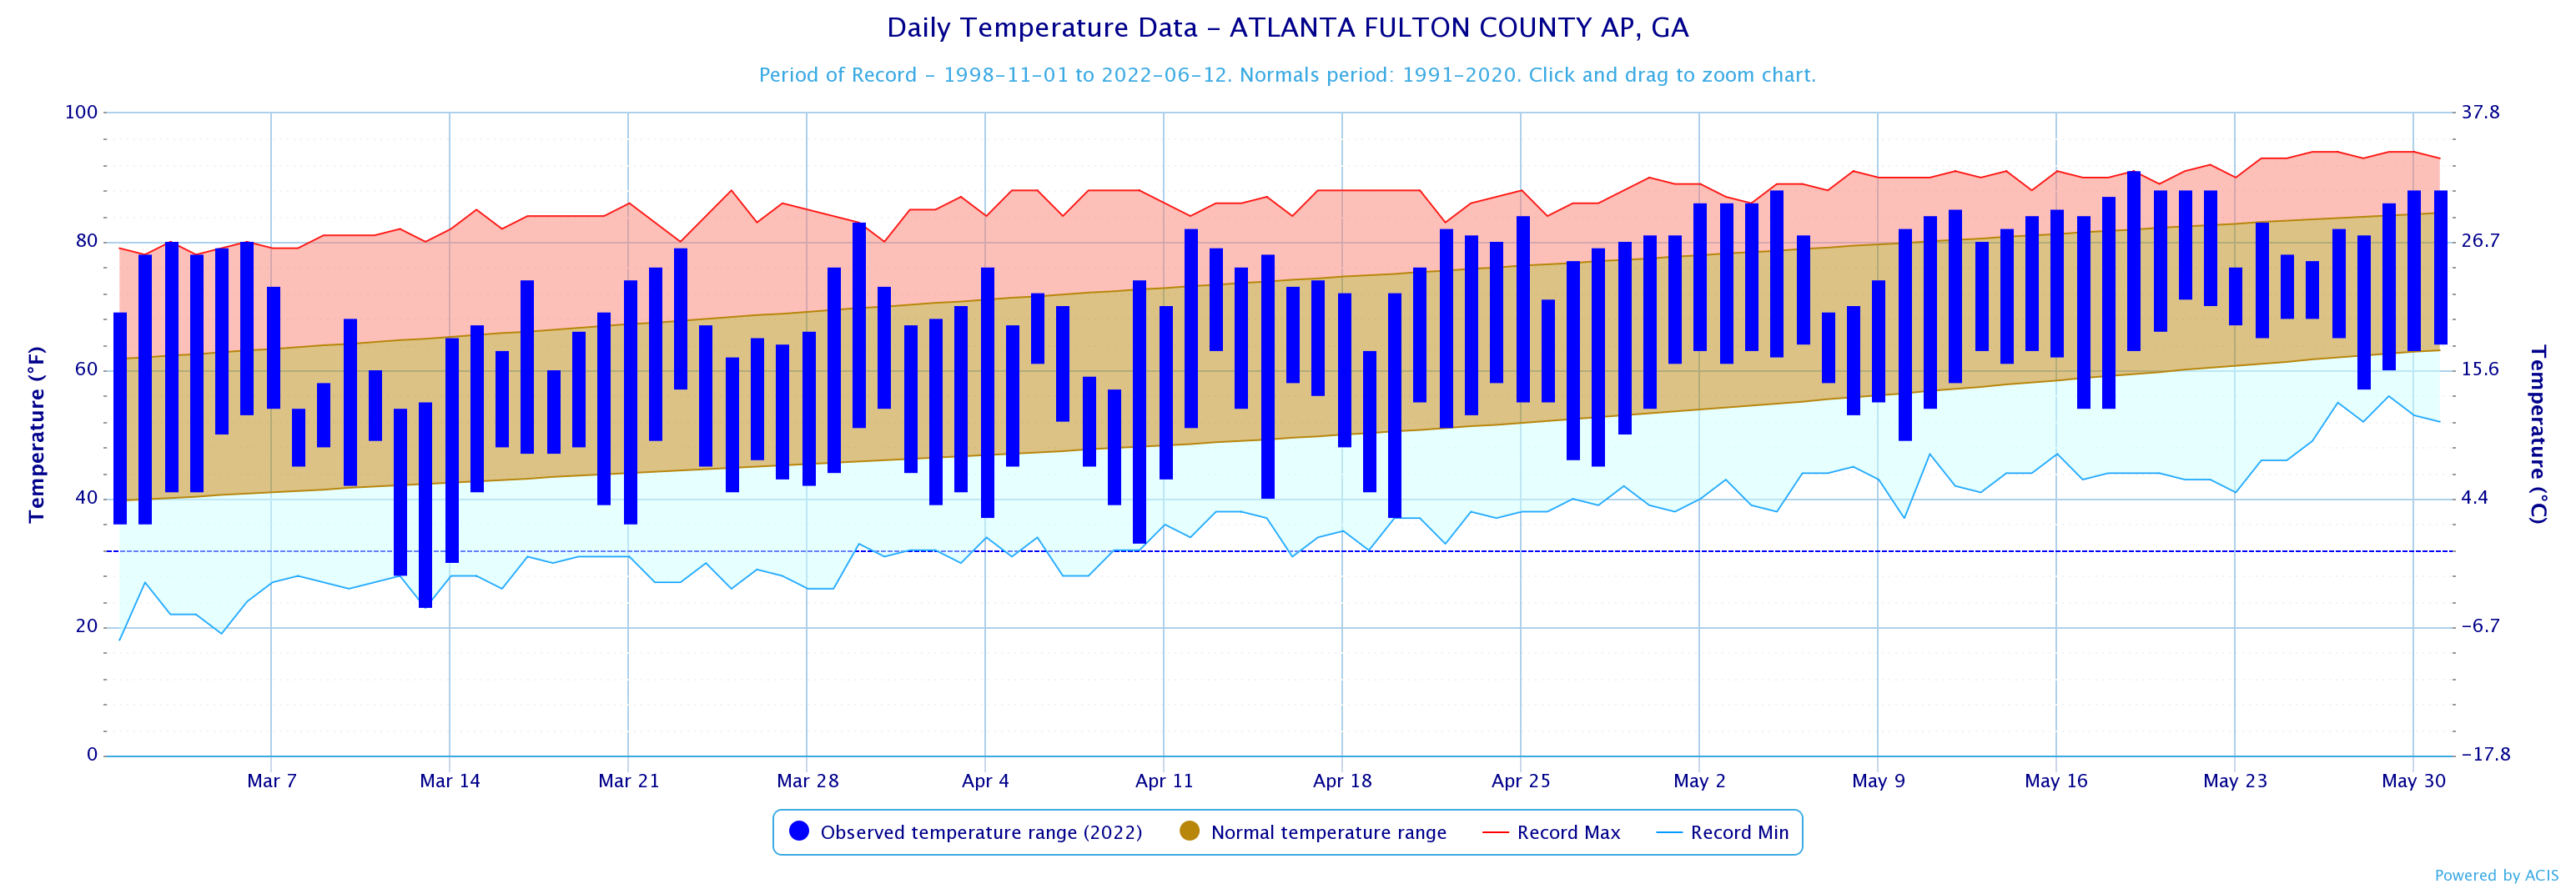
| Fulton Co Arpt | 99 | 6/15 | 58 | 6/20 |
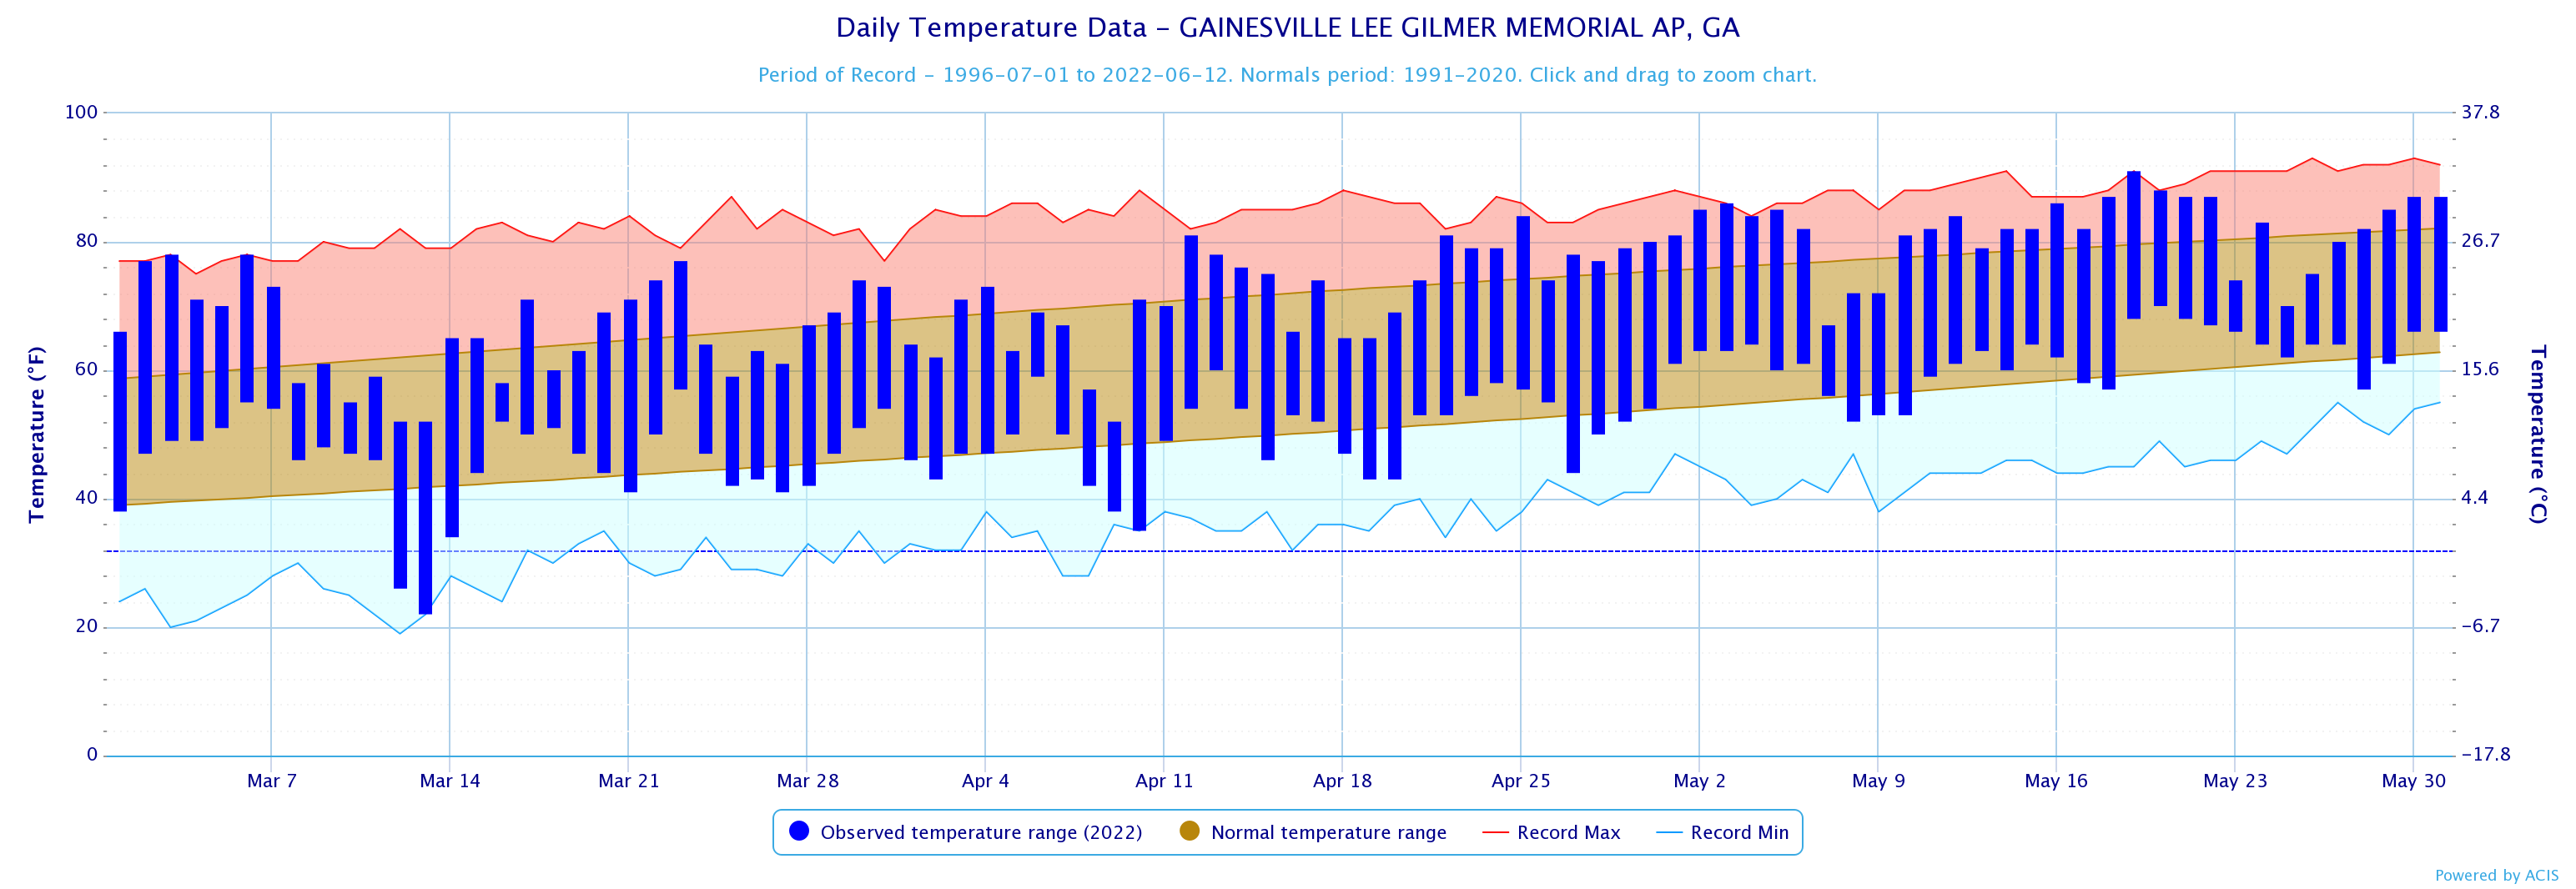
| Gainesville | 98 | 6/22 | 61 | 6/10 |
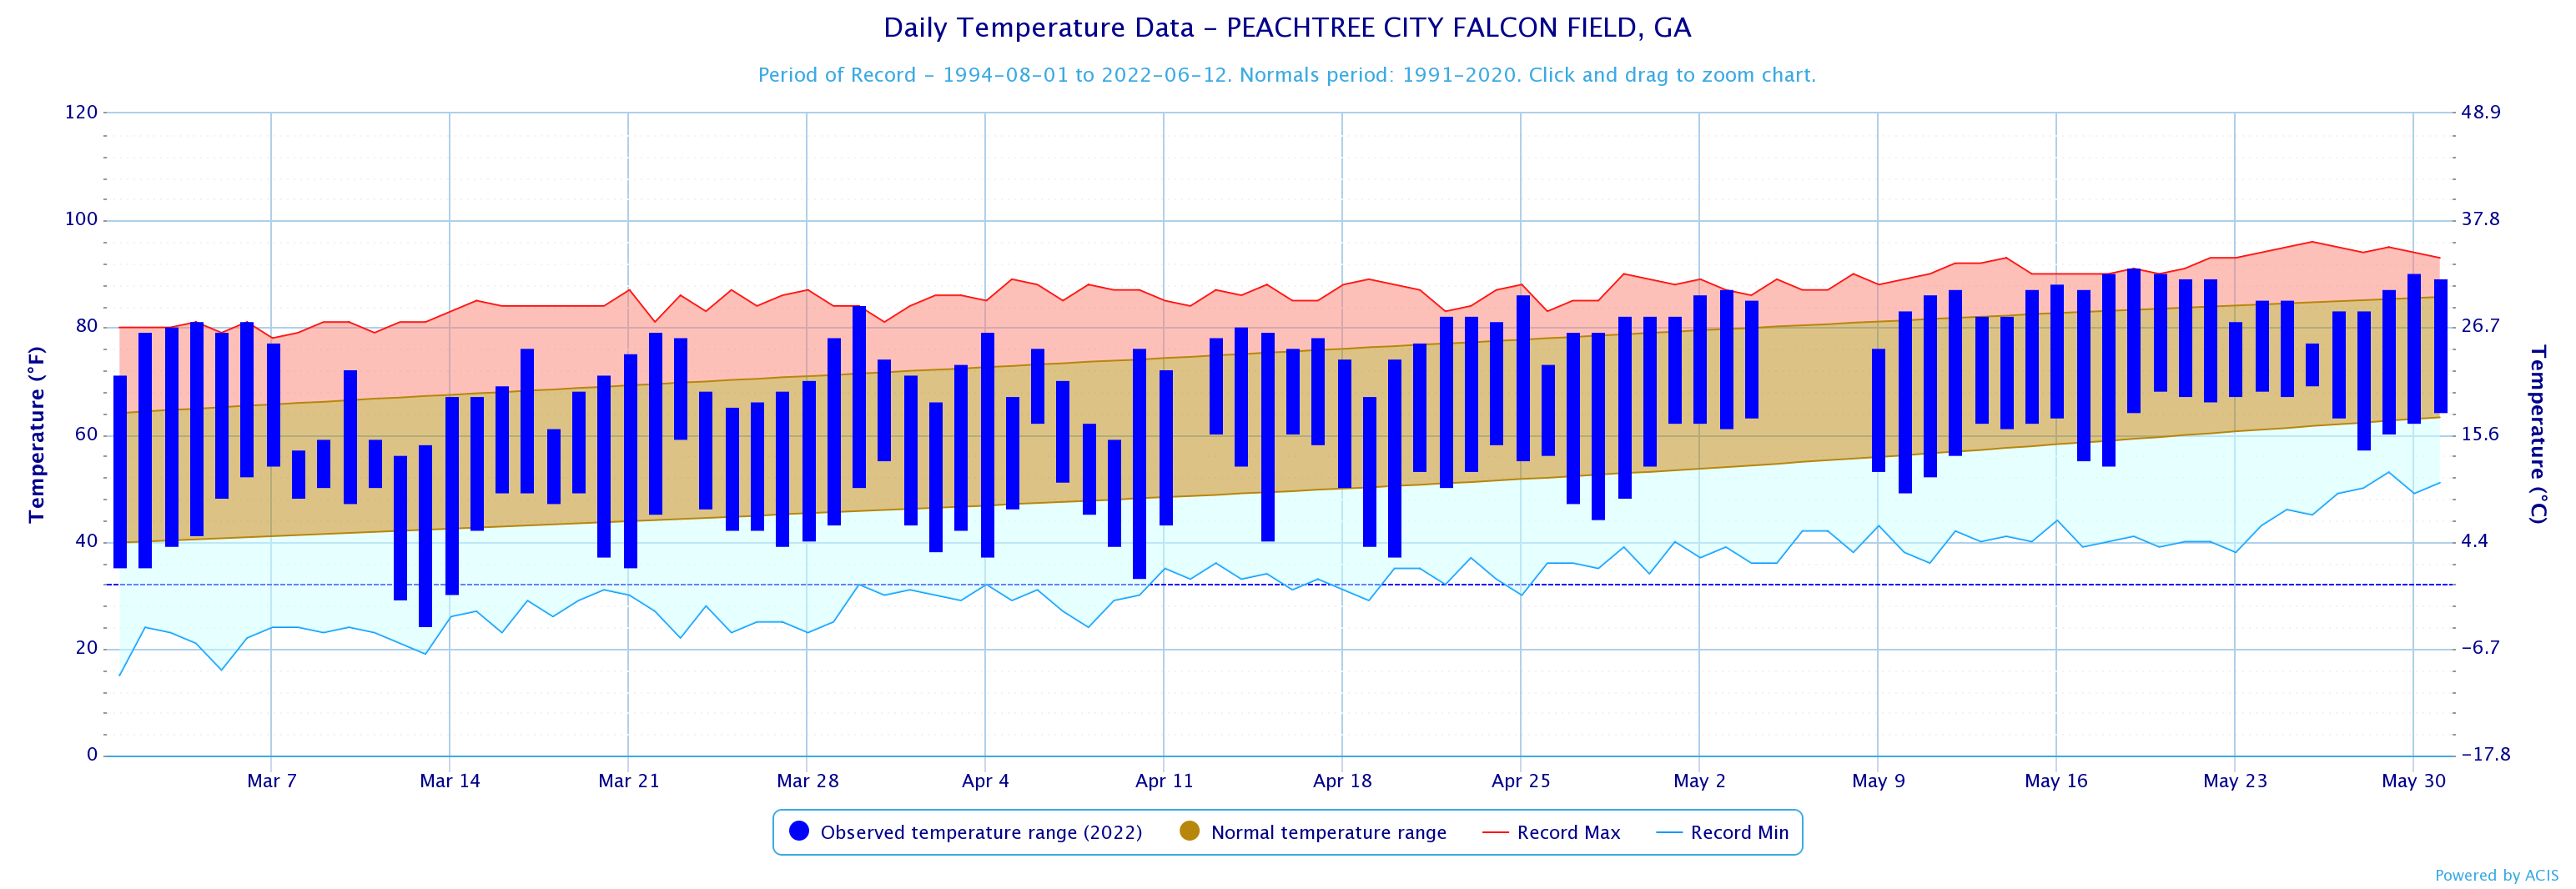
| Peachtree City | 102 | 6/15 | 58 | 6/20 |
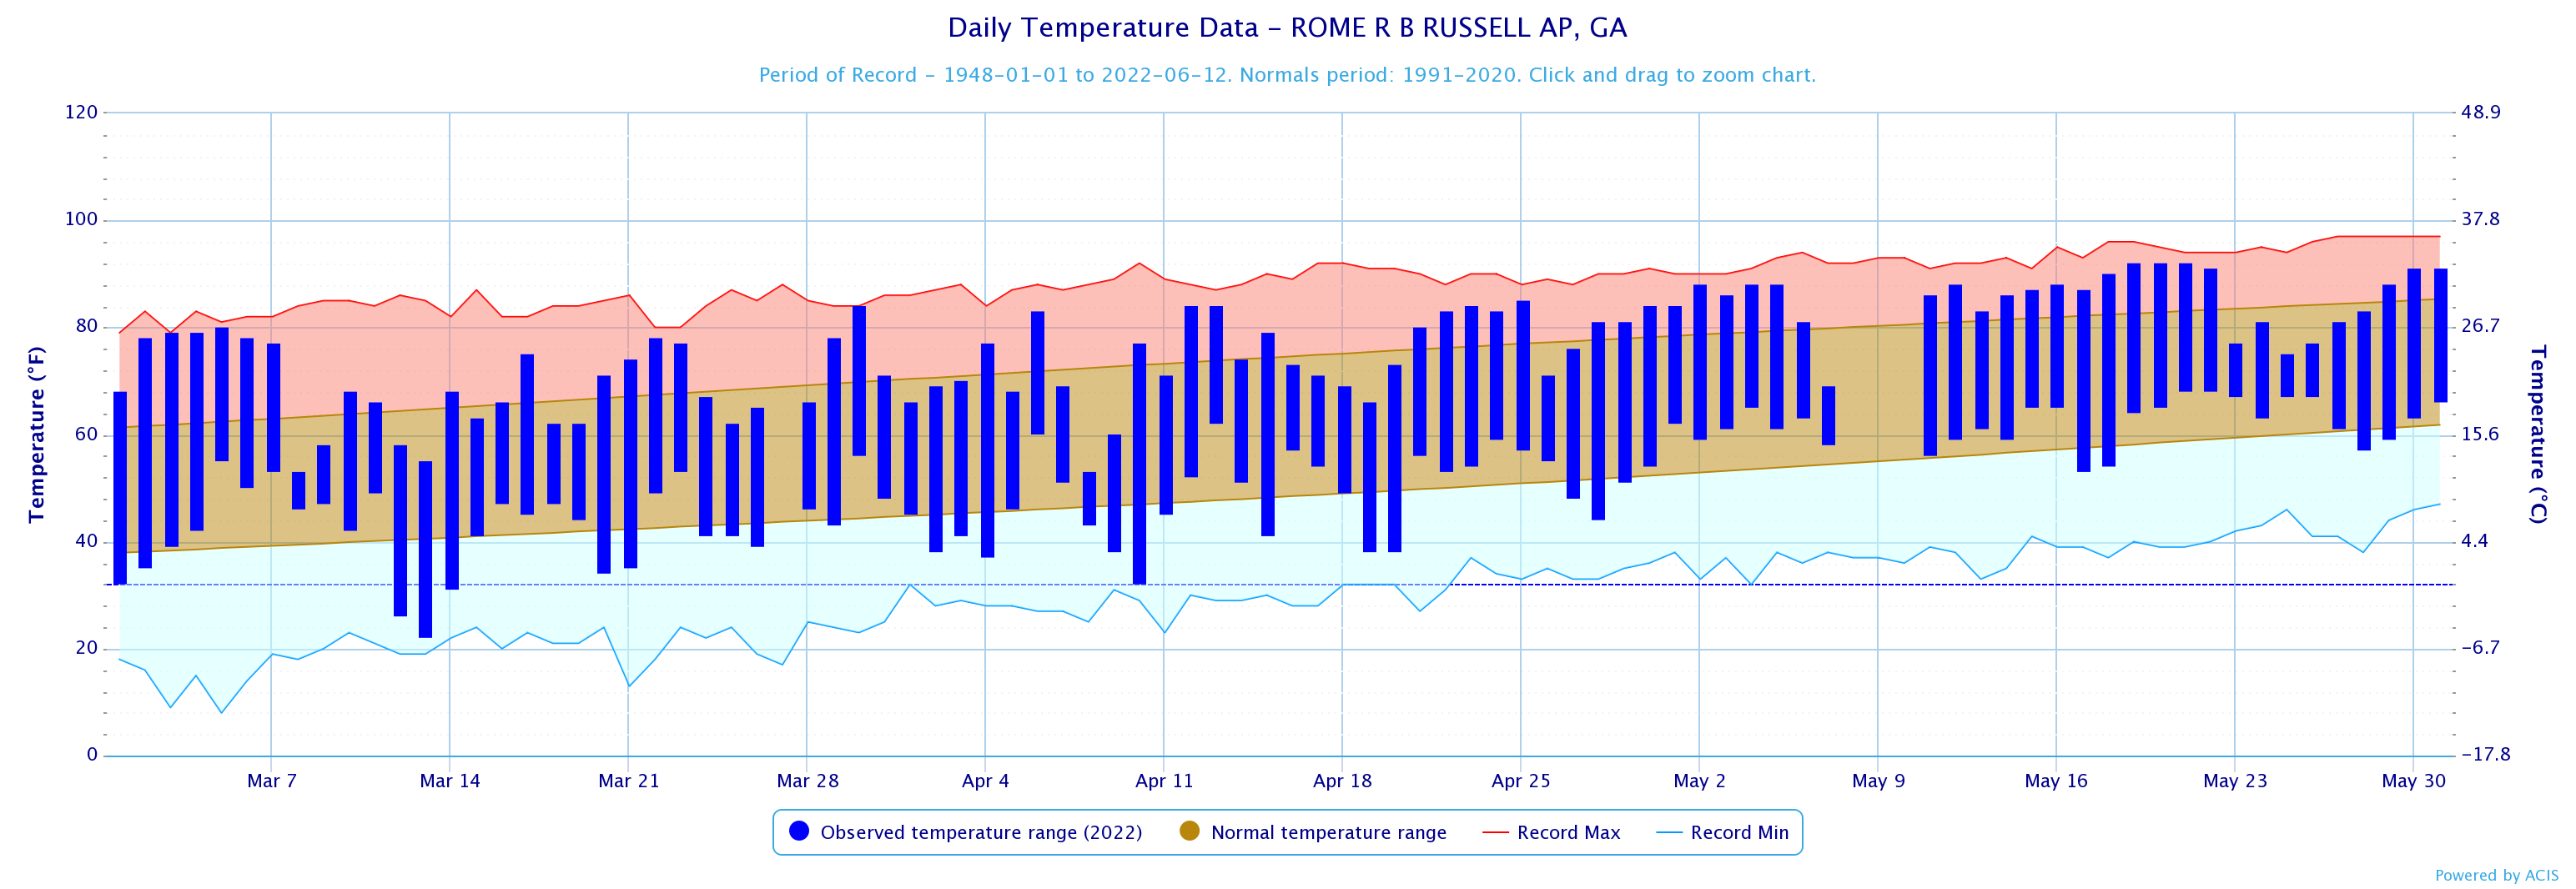
| Rome | 100 | 6/22, 23 | 57 | 6/20 |
| Summer 2022 Average Temperature Climate Statistics | ||
| Climate Site | Average Maximum Temperature (deg) | Average Minimum Temperature (deg) |
| Athens | 87.5 | 73.0 |
| Atlanta | 87.0 | 74.0 |
| Columbus | 89.5 | 75.5 |
| Macon | 88.0 | 77.0 |
| Cartersville | 86.0 | 70.5 |
| Dekalb Peachtree Arpt | 88.0 | 70.5 |
| Fulton Co Arpt | 87.0 | 71.5 |
| Gainesville | 71.0 | 87.0 |
| Peachtree City | 86.5 | 73.0 |
| Rome | 61.7 | 87.5 |
| Average Maximum Temperature Ranking & Records | |||
| Climate Site | Avg Max Temp Rank | Highest Avg Max Temp Record (deg) (Year) | Lowest Avg Max Temp Record (deg) (Year) |
| Athens | 18th Warmest | 91.5 (2007) | 81.5 (1967) |
| Atlanta | 25th Warmest | 92.0 (2012) | 80.5 (1967) |
| Columbus | 14th Warmest | 92.5 (2012) | 83.0 (1994) |
| Macon | 29th Warmest | 93.5 (1980) | 82.0 (1967) |
| Average Minimum Temperature Ranking & Records | |||
| Climate Site | Avg Min Temp Rank | Highest Avg Min Temp Record (deg) (Year) | Lowest Avg Min Temp Record (deg) (Year) |
| Athens | 2nd Warmest | 74.0 (1982) | 57.0 (1967) |
| Atlanta | 4th Warmest | 74.5 (2016) | 55.0 (1967) |
| Columbus | 3rd Warmest | 78.0 (2011) | 61.5 (1967) |
| Macon | Warmest on Record | 77.0 (2022) | 56.5 (1967) |
| Summer 2022 Precipitation Climate Statistics | |||
| Climate Site | Total Precipitation (in) | Normal Precipitation (in) | DFN (Departure From Normal) |
| Athens | 12.39 | 13.63 | -1.24 |
| Atlanta | 16.26 | 13.59 | +2.67 |
| Columbus | 9.47 | 13.06 | -3.59 |
| Macon | 18.30 | 13.61 | +4.69 |
| Cartersville | 16.34 | 11.11 | +5.23 |
| Dekalb Peachtree Arpt | 15.46 | 13.91 | +1.55 |
| Fulton County Arpt | 12.10 | 12.83 | -0.73 |
| Gainesville | 12.39 | 13.38 | -0.99 |
| Peachtree City | 9.88 | 13.25 | -3.37 |
| Rome | 7.84 | 11.31 | -3.47 |
| Summer 2022 Precipitation Ranking & Records | ||||
| Climate Site | Total Precipitation Ranking | Minimum Total Precip Record (in) (Year) | Maximum Total Precip Record (in) (Year) | |
| Athens | 36th Wettest | 4.28 (1957) | 29.39 (1994) | |
| Atlanta | 19th Wettest | 3.88 (1930) | 25.82 (2005) | |
| Columbus | 58th Wettest | 6.31 (1990) | 24.76 (2013) | |
| Macon | 7th Wettest | 5.00 (1997) | 29.26 (2013) |
| Summer 2022 Precipitation Climate Statistics | ||||
| Climate Site | Maximum Daily Precip (in) | Max P Date | ||
| Athens | 2.08 | 7/30 | ||
| Atlanta | 2.40 | 6/26 | ||
| Columbus | 1.47 | 8/18 | ||
| Macon | 3.45 | 6/24 | ||
| Cartersville | 2.33 | 7/1 | ||
| Dekalb Peachtree Arpt | 3.82 | 7/30 | ||
| Fulton Co Arpt | 2.10 | 6/24 | ||
| Gainesville | 1.85 | 7/3 | ||
| Peachtree City | 2.61 | 6/24 | ||
| Rome | 1.11 | 7/29 |
| Summer 2022 Temperature Climate Statistics | |||
| Climate Site | Average Temperature (deg) | Normal Temperature (deg) | DFN (Departure From Normal) |
| Athens | 80.4 | 79.5 | +0.9 |
| Atlanta | 80.7 | 79.7 | +1.0 |
| Columbus | 82.2 | 82.0 | +0.2 |
| Macon | 81.8 | 81.1 | +0.7 |
| Cartersville | 79.5 | 77.5 | +2.0 |
| Dekalb Peachtree Arpt | 79.4 | 78.1 | +1.3 |
| Fulton County Arpt | 79.8 | 78.8 | +1.0 |
| Gainesville | 79.4 | 77.5 | +1.9 |
| Peachtree City | 80.4 | 79.4 | +1.0 |
| Rome | 81.0 | 78.9 | +2.1 |
| Spring 2022 Temperature Climate Statistics | |||
| Climate Site | Average Temperature (deg) | Normal Temperature (deg) | DFN (Departure From Normal) |
| Athens | 63.9 | 62.0 | +1.9 |
| Atlanta | 65.1 | 62.1 | +3.0 |
| Columbus | 66.8 | 65.1 | +1.7 |
| Macon | 66.1 | 64.0 | +2.1 |
| Cartersville | 77.7 | 59.5 | +0.3 |
| Dekalb Peachtree Arpt | 62.7 | 61.4 | +1.3 |
| Fulton County Arpt | 63.1 | 61.3 | +1.8 |
| Gainesville | 62.8 | 60.4 | +2.4 |
| Peachtree City | 64.1 | 60.9 | +3.2 |
| Rome | 63.8 | 60.0 | +3.8 |
For much more information on the climate in our area, visit the NWS Climate FAQ for the Atlanta area.
What does the National Weather Service do?
The National Weather Service (NWS) is a part of the National Oceanic and Atmospheric Administration (NOAA).
The NWS describes its role as follows:
The National Weather Service (NWS) provides weather, water, and climate forecasts and warnings for the United States, its territories, adjacent waters and ocean areas, for the protection of life and property and the enhancement of the national economy. These services include Forecasts and Observations, Warnings, Impact-based Decision Support Services, and Education in an effort to build a Weather-Ready Nation. The ultimate goal is to have a society that is prepared for and responds to weather, water and climate events.
Read all the Cobb County Courier climate and weather coverage by following this link.