The City of Kennesaw issued the following press release about its upcoming Menorah Lighting in Depot Park:
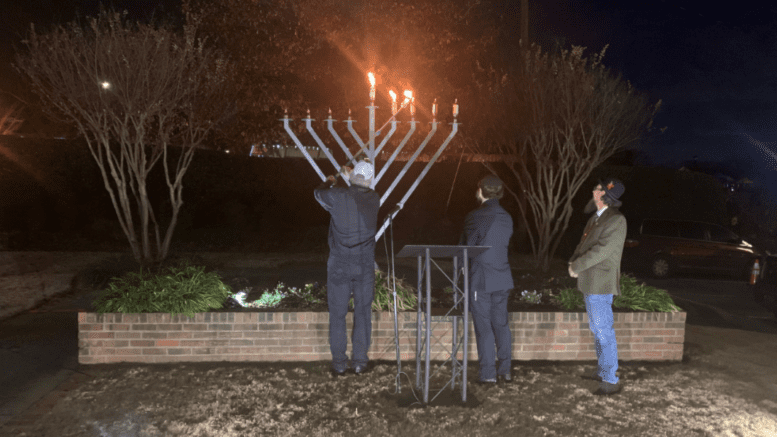
“Kennesaw, GA (December 2, 2022) — The City of Kennesaw, in partnership with Chabad of Kennesaw, will host the Menorah Lighting in Depot Park, located at 2828 Cherokee Street, on Wednesday, December 21, at 5:30 PM.
“This will be the fourth night of Hanukkah. The eight-day Jewish holiday commemorates the Jewish Maccabees’ military victory over Syrian-Greek oppression more than 2,000 years ago. During Hanukkah, Jews across the world celebrate the miracle of light that burnt for eight days out of a single-days-worth of oil found in the Temple. One Hanukkah candle is lit the first night and an additional candle is lit each successive night. The holiday is a celebration of religious freedom and hope.
“For more information, visit kennesaw-ga.gov/parks-and-recreation or call Kennesaw Parks & Recreation at 770-422-9714.”
About the City of Kennesaw
The City of Kennesaw was incorporated in 1887. With a population of 33,036 according to the recent decennial census, Kennesaw is the third-largest city in Cobb County, behind Marietta and Smyrna.
| Kennesaw city, Georgia | |
| Population Estimates, July 1 2021, (V2021) | NA |
| Population | |
| Population Estimates, July 1 2021, (V2021) | NA |
| Population estimates base, April 1, 2020, (V2021) | NA |
| Population, percent change – April 1, 2020 (estimates base) to July 1, 2021, (V2021) | NA |
| Population, Census, April 1, 2020 | 33,036 |
| Population, Census, April 1, 2010 | 29,783 |
| Age and Sex | |
| Persons under 5 years, percent | 7.4% |
| Persons under 18 years, percent | 23.3% |
| Persons 65 years and over, percent | 10.3% |
| Female persons, percent | 52.2% |
| Race and Hispanic Origin | |
| White alone, percent | 61.7% |
| Black or African American alone, percent(a) | 23.4% |
| American Indian and Alaska Native alone, percent(a) | 0.0% |
| Asian alone, percent(a) | 5.4% |
| Native Hawaiian and Other Pacific Islander alone, percent(a) | 0.1% |
| Two or More Races, percent | 6.5% |
| Hispanic or Latino, percent(b) | 15.9% |
| White alone, not Hispanic or Latino, percent | 52.1% |
| Population Characteristics | |
| Veterans, 2016-2020 | 2,100 |
| Foreign born persons, percent, 2016-2020 | 16.2% |
| Housing | |
| Housing units, July 1, 2019, (V2019) | X |
| Owner-occupied housing unit rate, 2016-2020 | 67.5% |
| Median value of owner-occupied housing units, 2016-2020 | $215,800 |
| Median selected monthly owner costs -with a mortgage, 2016-2020 | $1,536 |
| Median selected monthly owner costs -without a mortgage, 2016-2020 | $433 |
| Median gross rent, 2016-2020 | $1,347 |
| Building permits, 2020 | X |
| Families & Living Arrangements | |
| Households, 2016-2020 | 13,030 |
| Persons per household, 2016-2020 | 2.62 |
| Living in same house 1 year ago, percent of persons age 1 year+, 2016-2020 | 83.4% |
| Language other than English spoken at home, percent of persons age 5 years+, 2016-2020 | 22.7% |
| Computer and Internet Use | |
| Households with a computer, percent, 2016-2020 | 97.9% |
| Households with a broadband Internet subscription, percent, 2016-2020 | 95.7% |
| Education | |
| High school graduate or higher, percent of persons age 25 years+, 2016-2020 | 93.5% |
| Bachelor’s degree or higher, percent of persons age 25 years+, 2016-2020 | 44.8% |
| Health | |
| With a disability, under age 65 years, percent, 2016-2020 | 5.3% |
| Persons without health insurance, under age 65 years, percent | 14.6% |
| Economy | |
| In civilian labor force, total, percent of population age 16 years+, 2016-2020 | 71.4% |
| In civilian labor force, female, percent of population age 16 years+, 2016-2020 | 66.8% |
| Total accommodation and food services sales, 2012 ($1,000)(c) | 109,733 |
| Total health care and social assistance receipts/revenue, 2012 ($1,000)(c) | 104,760 |
| Total manufacturers shipments, 2012 ($1,000)(c) | 550,659 |
| Total retail sales, 2012 ($1,000)(c) | 840,389 |
| Total retail sales per capita, 2012(c) | $27,118 |
| Transportation | |
| Mean travel time to work (minutes), workers age 16 years+, 2016-2020 | 34.2 |
| Income & Poverty | |
| Median household income (in 2020 dollars), 2016-2020 | $72,972 |
| Per capita income in past 12 months (in 2020 dollars), 2016-2020 | $35,220 |
| Persons in poverty, percent | 12.5% |
| Businesses | |
| Total employer establishments, 2019 | X |
| Total employment, 2019 | X |
| Total annual payroll, 2019 ($1,000) | X |
| Total employment, percent change, 2018-2019 | X |
| Total nonemployer establishments, 2018 | X |
| All firms, 2012 | 3,908 |
| Men-owned firms, 2012 | 1,894 |
| Women-owned firms, 2012 | 1,651 |
| Minority-owned firms, 2012 | 1,337 |
| Nonminority-owned firms, 2012 | 2,384 |
| Veteran-owned firms, 2012 | 341 |
| Nonveteran-owned firms, 2012 | 3,361 |
| Geography | |
| Population per square mile, 2010 | 3,155.1 |
| Land area in square miles, 2010 | 9.44 |
| FIPS Code | 1343192 |