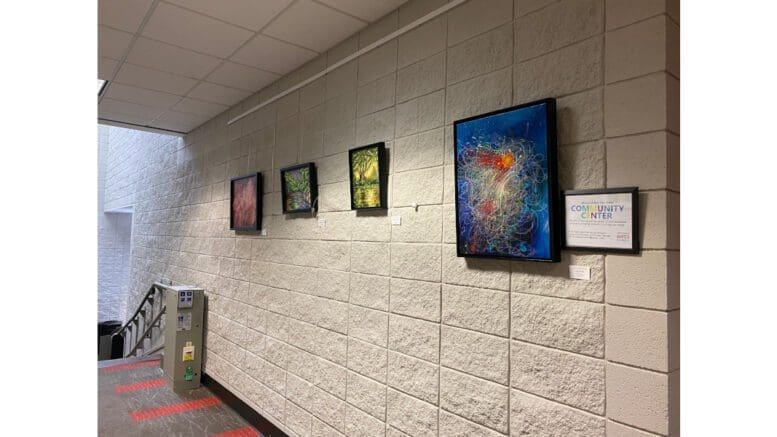
The Smyrna Arts Council and the City of Smyrna are presenting an exhibit featuring the work of nine local artists who work in a variety of media.
The artists are Juliette McKinley, Justin Groom, Richard Brodowski, Kandus Johnson, the Walesh family, Money, Becca McCoy, Shelly Leitheiser, and Ashley L. Schick.
This will be the inaugural exhibit for the new Smyrna Community Center at 200 Village Green Circle in downtown Smyrna. The exhibit is available for viewing at any time the Community Center is open to the public until December 1, 2023.
Past exhibits have been held at Smyrna City Hall.

About the Smyrna Arts Council
The Smyrna Arts Council is a 5019(c)(3) nonprofit organization created in 2015 to promote, nurture and support the arts in Smyrna. It’s an independent volunteer organization, and donations are tax-deductible.
The organization’s website describes its mission as follows:
“Our mission is to cultivate and promote the arts for the enjoyment and enrichment of our diverse community.
“From painting to mixed media, photography, sculpture, music, dance, and theatre, we are committed to aligning our activities and efforts to our mission and to honoring the diversity that Smyrna enjoys.”
For more information visit the Smyrna Arts Council website at https://smyrnaartscouncil.com/
About the City of Smyrna
Smyrna is the third-largest city in Cobb County, after newly incorporated Mableton, and county seat Marietta.
Smyrna was incorporated by an act of the Georgia legislature in 1872. To see a copy of the original incorporation legislation, follow this link.
The U.S. Census Bureau gives the latest quick facts about Smyrna:
| Smyrna city, Georgia | |
| Population Estimates, July 1 2021, (V2021) | 55,685 |
| PeoplePopulation | |
| Population Estimates, July 1 2021, (V2021) | 55,685 |
| Population estimates base, April 1, 2020, (V2021) | 55,689 |
| Population, percent change – April 1, 2020 (estimates base) to July 1, 2021, (V2021) | 0.0% |
| Population, Census, April 1, 2020 | 55663 |
| Population, Census, April 1, 2010 | 51271 |
| Age and Sex | |
| Persons under 5 years, percent | 7.8% |
| Persons under 18 years, percent | 23.2% |
| Persons 65 years and over, percent | 9.3% |
| Female persons, percent | 53.0% |
| Race and Hispanic Origin | |
| White alone, percent | 46.8% |
| Black or African American alone, percent(a) | 33.2% |
| American Indian and Alaska Native alone, percent(a) | 0.3% |
| Asian alone, percent(a) | 8.2% |
| Native Hawaiian and Other Pacific Islander alone, percent(a) | 0.3% |
| Two or More Races, percent | 4.5% |
| Hispanic or Latino, percent(b) | 13.6% |
| White alone, not Hispanic or Latino, percent | 42.9% |
| Population Characteristics | |
| Veterans, 2016-2020 | 2352 |
| Foreign born persons, percent, 2016-2020 | 16.5% |
| Housing | |
| Housing units, July 1, 2021, (V2021) | X |
| Owner-occupied housing unit rate, 2016-2020 | 55.5% |
| Median value of owner-occupied housing units, 2016-2020 | $309,000 |
| Median selected monthly owner costs -with a mortgage, 2016-2020 | $1,871 |
| Median selected monthly owner costs -without a mortgage, 2016-2020 | $471 |
| Median gross rent, 2016-2020 | $1,326 |
| Building permits, 2021 | X |
| Families & Living Arrangements | |
| Households, 2016-2020 | 24760 |
| Persons per household, 2016-2020 | 2.27 |
| Living in same house 1 year ago, percent of persons age 1 year+, 2016-2020 | 81.1% |
| Language other than English spoken at home, percent of persons age 5 years+, 2016-2020 | 21.1% |
| Computer and Internet Use | |
| Households with a computer, percent, 2016-2020 | 97.9% |
| Households with a broadband Internet subscription, percent, 2016-2020 | 95.6% |
| Education | |
| High school graduate or higher, percent of persons age 25 years+, 2016-2020 | 94.0% |
| Bachelor’s degree or higher, percent of persons age 25 years+, 2016-2020 | 55.7% |
| Health | |
| With a disability, under age 65 years, percent, 2016-2020 | 6.2% |
| Persons without health insurance, under age 65 years, percent | 13.8% |
| Economy | |
| In civilian labor force, total, percent of population age 16 years+, 2016-2020 | 77.8% |
| In civilian labor force, female, percent of population age 16 years+, 2016-2020 | 72.9% |
| Total accommodation and food services sales, 2012 ($1,000)(c) | 152259 |
| Total health care and social assistance receipts/revenue, 2012 ($1,000)(c) | 293700 |
| Total manufacturers shipments, 2012 ($1,000)(c) | 208663 |
| Total retail sales, 2012 ($1,000)(c) | 1028830 |
| Total retail sales per capita, 2012(c) | $19,541 |
| Transportation | |
| Mean travel time to work (minutes), workers age 16 years+, 2016-2020 | 29 |
| Income & Poverty | |
| Median household income (in 2020 dollars), 2016-2020 | $77,713 |
| Per capita income in past 12 months (in 2020 dollars), 2016-2020 | $48,063 |
| Persons in poverty, percent | 8.2% |
| BusinessesBusinesses | |
| Total employer establishments, 2020 | X |
| Total employment, 2020 | X |
| Total annual payroll, 2020 ($1,000) | X |
| Total employment, percent change, 2019-2020 | X |
| Total nonemployer establishments, 2018 | X |
| All firms, 2012 | 6575 |
| Men-owned firms, 2012 | 3108 |
| Women-owned firms, 2012 | 2808 |
| Minority-owned firms, 2012 | 2970 |
| Nonminority-owned firms, 2012 | 3230 |
| Veteran-owned firms, 2012 | 687 |
| Nonveteran-owned firms, 2012 | 5483 |
| Geography | |
| Population per square mile, 2010 | 3339.5 |
| Land area in square miles, 2010 | 15.35 |