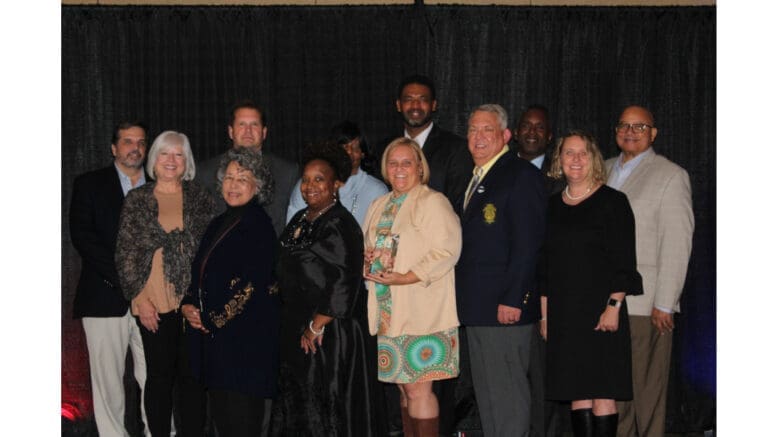
Photos courtesy of the City of Powder Springs
The City of Powder Springs announced in the following news release that their parks & recreation department was honored with Georgia’s Agency of the Year in the cities with population under 20,000 category.
Powder Springs’ Parks, Recreation and Cultural Affairs department is at the top of its class, recognized last month at the Georgia Recreation and Park Association Awards Banquet in Athens as the 2023 Agency of the Year (Population under 20,000).
The department of six employees — four full-time and two part-time — manages 47 acres of park space as well as the Patricia C. Vaughn Cultural Arts Center, the multipurpose Ford Center Reception Hall, and the Seven Springs Museum at the Bodiford House. In July, the department opened the city’s new Skate Park at Silver Comet Linear Park, which welcomed several pro skaters and skate enthusiasts at a grand opening event in October.
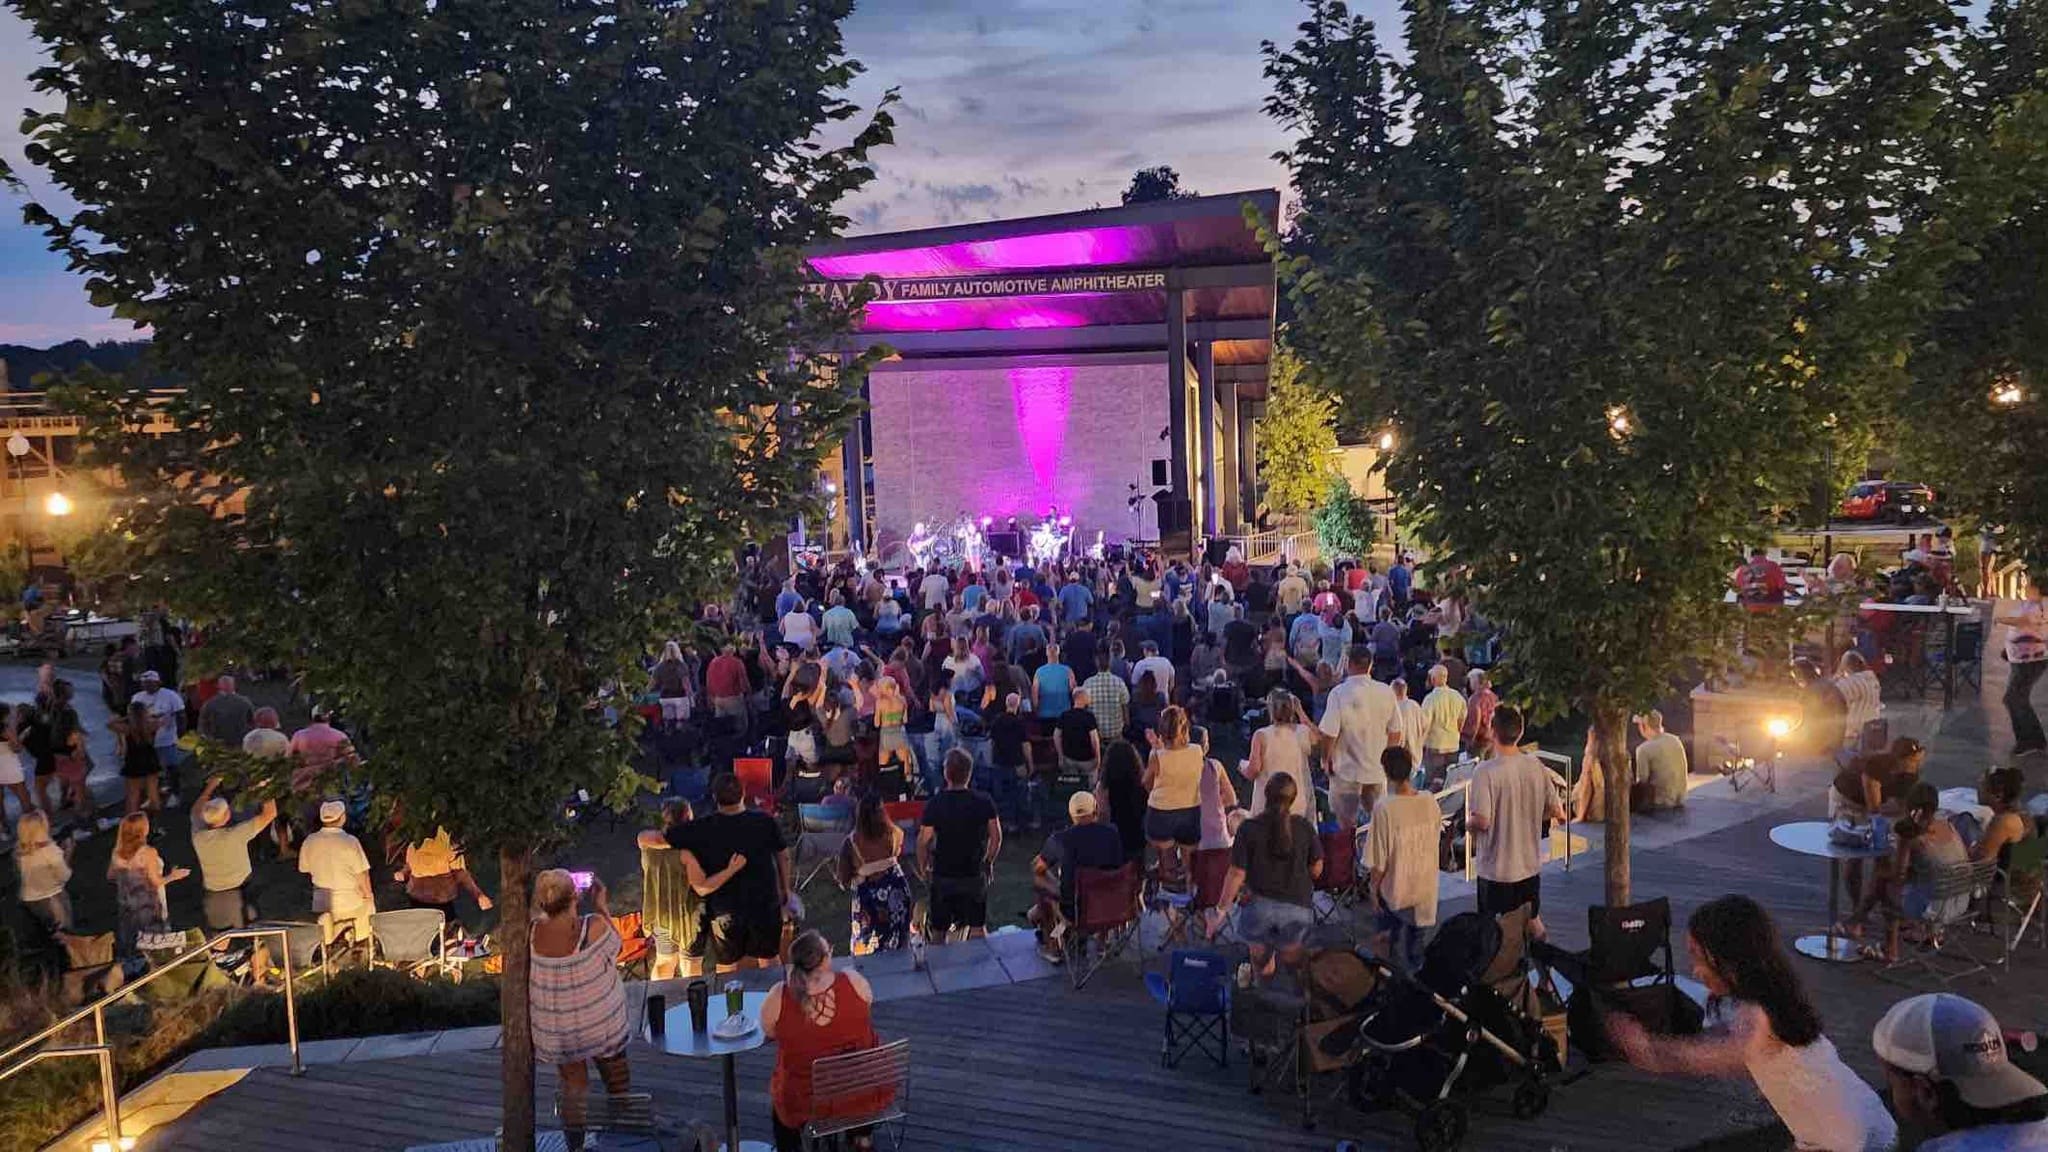
The department’s programs and hosted events serve residents and visitors of all ages. Drawing over 10,000 visitors each May to Thurman Springs Park is the “Bringing The Sea to the Springs” seafood festival, which earned in 2022 the “Spot On Event of the Year” honor from Cobb Travel & Tourism. Hundreds more have enjoyed each of three concerts offered in the park during each annual “Sounds of the Springs” summer concert series, which like the Seafood Festival will celebrate its fourth year in 2024.
An estimated 500 families attended this year’s Family to Park Day summer movie series. The city’s senior citizens, meanwhile, have been able to take advantage of programs such as the Seniors in Motion weekly line dancing classes, a “sip ’n’ paint” series, and senior trips ranging from shopping outings in Jasper and Duluth to plays at the Fox Theatre and museums such as the Tubman Museum of African American Art.
Even the city’s four-legged residents have had their day in the sun, with the annual “Bark in the Park” in June welcoming about 75 dog-loving families and their furry family members.
Not content with resting on their laurels, the department is already busy with planning an eventful 2024 calendar, which will bring back all of the aforementioned events and add a series of Brown Bag Lunch midday concerts in April to complement the annual September slate of such concerts.
About Powder Springs
The City of Powder Springs was incorporated in September of 1883. To read the original incorporation act from the State of Georgia please visit this link.
The area before incorporation had been known as Gunpowder Springs, possibly because of the dark sand in the water.
Powder Springs is the sixth largest city in Cobb County, larger only than nearby Austell.
The U.S. Census Bureau gives the following quick facts about the City of Powder Springs (estimates are periodically updated on the Cenus Bureau website, so visit the link above for the latest estimates):
| Population | |
| Population Estimates, July 1 2021, (V2021) | 17,083 |
| Population estimates base, April 1, 2020, (V2021) | 16,901 |
| Population, percent change – April 1, 2020 (estimates base) to July 1, 2021, (V2021) | 1.1% |
| Population, Census, April 1, 2020 | 16,887 |
| Population, Census, April 1, 2010 | 13,940 |
| Age and Sex | |
| Persons under 5 years, percent | 6.6% |
| Persons under 18 years, percent | 24.3% |
| Persons 65 years and over, percent | 14.6% |
| Female persons, percent | 56.8% |
| Race and Hispanic Origin | |
| White alone, percent | 34.2% |
| Black or African American alone, percent(a) | 56.0% |
| American Indian and Alaska Native alone, percent(a) | 1.3% |
| Asian alone, percent(a) | 1.5% |
| Native Hawaiian and Other Pacific Islander alone, percent(a) | 0.0% |
| Two or More Races, percent | 2.9% |
| Hispanic or Latino, percent(b) | 14.7% |
| White alone, not Hispanic or Latino, percent | 29.5% |
| Population Characteristics | |
| Veterans, 2016-2020 | 1,356 |
| Foreign born persons, percent, 2016-2020 | 9.6% |
| Housing | |
| Housing units, July 1, 2021, (V2021) | X |
| Owner-occupied housing unit rate, 2016-2020 | 80.1% |
| Median value of owner-occupied housing units, 2016-2020 | $181,000 |
| Median selected monthly owner costs -with a mortgage, 2016-2020 | $1,328 |
| Median selected monthly owner costs -without a mortgage, 2016-2020 | $453 |
| Median gross rent, 2016-2020 | $1,296 |
| Building permits, 2021 | X |
| Families & Living Arrangements | |
| Households, 2016-2020 | 5,570 |
| Persons per household, 2016-2020 | 2.72 |
| Living in same house 1 year ago, percent of persons age 1 year+, 2016-2020 | 89.1% |
| Language other than English spoken at home, percent of persons age 5 years+, 2016-2020 | 15.2% |
| Computer and Internet Use | |
| Households with a computer, percent, 2016-2020 | 94.6% |
| Households with a broadband Internet subscription, percent, 2016-2020 | 91.1% |
| Education | |
| High school graduate or higher, percent of persons age 25 years+, 2016-2020 | 94.1% |
| Bachelor’s degree or higher, percent of persons age 25 years+, 2016-2020 | 39.4% |
| Health | |
| With a disability, under age 65 years, percent, 2016-2020 | 8.6% |
| Persons without health insurance, under age 65 years, percent | 9.4% |
| Economy | |
| In civilian labor force, total, percent of population age 16 years+, 2016-2020 | 67.6% |
| In civilian labor force, female, percent of population age 16 years+, 2016-2020 | 63.5% |
| Total accommodation and food services sales, 2017 ($1,000)(c) | 29,526 |
| Total health care and social assistance receipts/revenue, 2017 ($1,000)(c) | 39,184 |
| Total transportation and warehousing receipts/revenue, 2017 ($1,000)(c) | 7,540 |
| Total retail sales, 2017 ($1,000)(c) | 181,543 |
| Total retail sales per capita, 2017(c) | $12,102 |
| Transportation | |
| Mean travel time to work (minutes), workers age 16 years+, 2016-2020 | 37.6 |
| Income & Poverty | |
| Median household income (in 2020 dollars), 2016-2020 | $72,810 |
| Per capita income in past 12 months (in 2020 dollars), 2016-2020 | $32,601 |
| Persons in poverty, percent | 6.3% |
| Businesses | |
| Total employer establishments, 2020 | X |
| Total employment, 2020 | X |
| Total annual payroll, 2020 ($1,000) | X |
| Total employment, percent change, 2019-2020 | X |
| Total nonemployer establishments, 2019 | X |
| All employer firms, Reference year 2017 | 300 |
| Men-owned employer firms, Reference year 2017 | 134 |
| Women-owned employer firms, Reference year 2017 | S |
| Minority-owned employer firms, Reference year 2017 | S |
| Nonminority-owned employer firms, Reference year 2017 | 170 |
| Veteran-owned employer firms, Reference year 2017 | S |
| Nonveteran-owned employer firms, Reference year 2017 | 247 |
7.17
| Geography | |
| Population per square mile, 2020 | 2,288.5 |
| Population per square mile, 2010 | 1,944.7 |
| Land area in square miles, 2020 | 7.38 |
| Land area in square miles, 2010 |
| Population Estimates, July 1 2021, (V2021) | 17,083 |