The City of Austell will host a Black History Month Creatives Market on February 17th, 2024.
Free vendor registration is now open.
Here is the announcement distributed by the City of Austell:
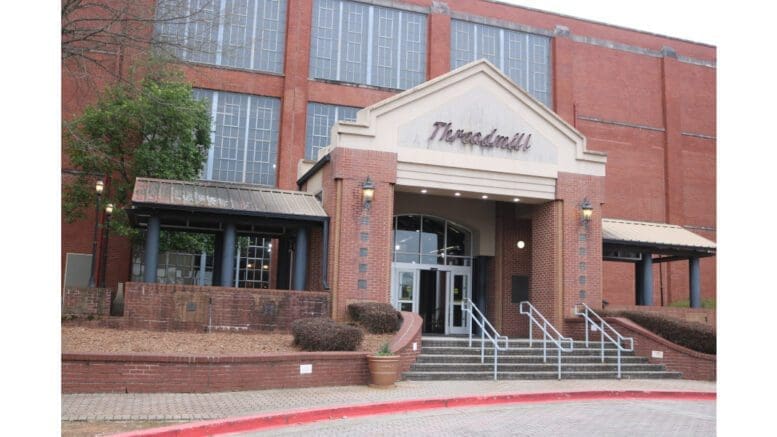
The City of Austell will host an enriching day of creativity and networking showcasing local black owned businesses at the Threadmill Complex on Saturday, February 17th, 2024, from 10 a.m. – 3 p.m.
This event invites residents and their neighbors to join in a day of dance, art, music, food and much more!
The complex is located at 5000 Austell Powder Springs Rd Austell GA 30106.
For vending opportunities, please contact Debbie Antoniou-Conner at dantoniou@austellga.gov
About the City of Austell
The smallest city in Cobb County with a population of just under 8,000, the City of Austell was incorporated on September 4, 1885.
The original city limits of the town were a circle with a radius of one-half mile from a railway terminal used by the Georgia Pacific Railway Company and the East Tennessee, Virginia and Georgia Railroad Company.
The U.S. Census Bureau provides the following quick facts about the city:
| Population Estimates, July 1, 2022, (V2022) | 7,896 |
| Population | |
| Population Estimates, July 1, 2022, (V2022) | 7,896 |
| Population estimates base, April 1, 2020, (V2022) | 7,710 |
| Population, percent change – April 1, 2020 (estimates base) to July 1, 2022, (V2022) | 2.4% |
| Population, Census, April 1, 2020 | 7,713 |
| Population, Census, April 1, 2010 | 6,581 |
| Age and Sex | |
| Persons under 5 years, percent | 4.6% |
| Persons under 18 years, percent | 28.9% |
| Persons 65 years and over, percent | 8.2% |
| Female persons, percent | 52.4% |
| Race and Hispanic Origin | |
| White alone, percent | 29.9% |
| Black or African American alone, percent(a) | 61.9% |
| American Indian and Alaska Native alone, percent(a) | 0.0% |
| Asian alone, percent(a) | 0.0% |
| Native Hawaiian and Other Pacific Islander alone, percent(a) | 0.0% |
| Two or More Races, percent | 6.0% |
| Hispanic or Latino, percent(b) | 8.0% |
| White alone, not Hispanic or Latino, percent | 25.1% |
| Population Characteristics | |
| Veterans, 2017-2021 | 385 |
| Foreign born persons, percent, 2017-2021 | 4.6% |
| Housing | |
| Housing units, July 1, 2022, (V2022) | X |
| Owner-occupied housing unit rate, 2017-2021 | 60.0% |
| Median value of owner-occupied housing units, 2017-2021 | $156,000 |
| Median selected monthly owner costs -with a mortgage, 2017-2021 | $1,268 |
| Median selected monthly owner costs -without a mortgage, 2017-2021 | $317 |
| Median gross rent, 2017-2021 | $1,258 |
| Building permits, 2022 | X |
| Families & Living Arrangements | |
| Households, 2017-2021 | 2,802 |
| Persons per household, 2017-2021 | 2.92 |
| Living in same house 1 year ago, percent of persons age 1 year+, 2017-2021 | 93.4% |
| Language other than English spoken at home, percent of persons age 5 years+, 2017-2021 | 10.7% |
| Computer and Internet Use | |
| Households with a computer, percent, 2017-2021 | 96.6% |
| Households with a broadband Internet subscription, percent, 2017-2021 | 93.0% |
| Education | |
| High school graduate or higher, percent of persons age 25 years+, 2017-2021 | 87.8% |
| Bachelor’s degree or higher, percent of persons age 25 years+, 2017-2021 | 21.8% |
| Health | |
| With a disability, under age 65 years, percent, 2017-2021 | 6.5% |
| Persons without health insurance, under age 65 years, percent | 20.5% |
| Economy | |
| In civilian labor force, total, percent of population age 16 years+, 2017-2021 | 73.0% |
| In civilian labor force, female, percent of population age 16 years+, 2017-2021 | 70.6% |
| Total accommodation and food services sales, 2017 ($1,000)(c) | D |
| Total health care and social assistance receipts/revenue, 2017 ($1,000)(c) | 524,040 |
| Total transportation and warehousing receipts/revenue, 2017 ($1,000)(c) | 29,462 |
| Total retail sales, 2017 ($1,000)(c) | D |
| Total retail sales per capita, 2017(c) | NA |
| Transportation | |
| Mean travel time to work (minutes), workers age 16 years+, 2017-2021 | 29.2 |
| Income & Poverty | |
| Median household income (in 2021 dollars), 2017-2021 | $59,459 |
| Per capita income in past 12 months (in 2021 dollars), 2017-2021 | $24,230 |
| Persons in poverty, percent | 5.1% |
| Businesses | |
| Total employer establishments, 2021 | X |
| Total employment, 2021 | X |
| Total annual payroll, 2021 ($1,000) | X |
| Total employment, percent change, 2020-2021 | X |
| Total nonemployer establishments, 2019 | X |
| All employer firms, Reference year 2017 | 219 |
| Men-owned employer firms, Reference year 2017 | 104 |
| Women-owned employer firms, Reference year 2017 | 64 |
| Minority-owned employer firms, Reference year 2017 | S |
| Nonminority-owned employer firms, Reference year 2017 | 101 |
| Veteran-owned employer firms, Reference year 2017 | S |
| Nonveteran-owned employer firms, Reference year 2017 | 172 |
| Geography | |
| Population per square mile, 2020 | 1,299.8 |
| Population per square mile, 2010 | 1,102.5 |
| Land area in square miles, 2020 | 5.93 |
| Land area in square miles, 2010 | 5.97 |
| FIPS Code | 1304252 |
