
The Cobb County Sheriff’s Office has announced a traffic plan for the area around Jim R. Miller Park for the 2024 North Georgia State Fair Sept. 19–29, Jim Miller Fairgrounds, 2245 Callaway Road, Marietta.
The announcement states the purpose is to reduce congestion in nearby residential areas and to make parking for the event easier.
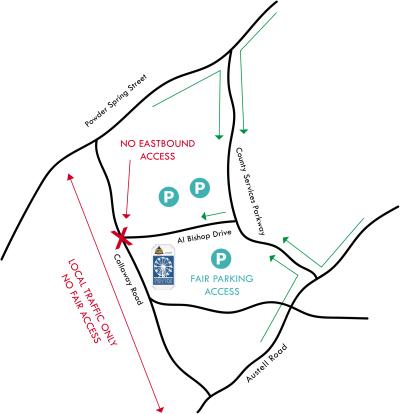
The biggest change is that access to Callaway Road will be restricted to local traffic.
“Sheriff’s deputies will restrict access from Callaway Road to Al Bishop Drive, and signage will clearly indicate that fair parking is not accessible from Callaway Road,” the announcement states.
Traffic from Powder Springs Road and Austell Road will be routed to County Services Parkway for access to the parking lots.
Other key elements of the traffic plan listed in the announcement include:
- Deputies will dedicate two of the three lanes on Al Bishop Drive for westbound traffic heading toward the parking areas. Deputies will also be stationed to guide traffic from County Services Parkway.
- A shuttle service will run from the Cobb County Safety Village, near the parking lots, to transport fairgoers to the front gate.
- The Uber/Lyft pickup and drop-off zone will also be located at the Safety Village.
- Cobb DOT’s Traffic Management Center will be operational during fair hours to monitor traffic lights at area intersections and adjust timing to prevent long backups on Callaway Road.
“We believe this traffic plan will work,” Major Jacob Huval told residents at an open house this week. “This new flow should keep traffic moving on Callaway Road and help prevent the long backups residents have experienced in recent years.”
According to the announcement:
Residents of neighborhoods off Callaway Road have long expressed concerns about the traffic congestion that worsened as the fair grew in popularity. Parking in those neighborhoods has also been a concern. County Manager Dr. Jackie McMorris assured residents that officials will hold a follow-up meeting after the fair to review the traffic plan’s effectiveness and determine whether further changes are needed.
About the City of Marietta
The City of Marietta is the county seat of Cobb County. The latest estimate from the U.S. Census Bureau puts the population of the city at 62,769 which makes it the second largest city in Cobb County by population, smaller only than the newly incorporated City of Mableton.
Here are a few quick facts from the Census Bureau
| Population | |
| Population estimates, July 1, 2023, (V2023) | 62,769 |
| Population estimates base, April 1, 2020, (V2023) | 61,073 |
| Population, percent change – April 1, 2020 (estimates base) to July 1, 2023, (V2023) | 2.8% |
| Population, Census, April 1, 2020 | 60,972 |
| Population, Census, April 1, 2010 | 56,579 |
| Age and Sex | |
| Persons under 5 years, percent | 6.0% |
| Persons under 18 years, percent | 20.7% |
| Persons 65 years and over, percent | 14.2% |
| Female persons, percent | 51.3% |
| Race and Hispanic Origin | |
| White alone, percent | 45.3% |
| Black or African American alone, percent(a) | 30.8% |
| American Indian and Alaska Native alone, percent(a) | 1.3% |
| Asian alone, percent(a) | 2.1% |
| Native Hawaiian and Other Pacific Islander alone, percent(a) | 0.0% |
| Two or More Races, percent | 8.6% |
| Hispanic or Latino, percent(b) | 18.8% |
| White alone, not Hispanic or Latino, percent | 42.4% |
| Population Characteristics | |
| Veterans, 2018-2022 | 2,377 |
| Foreign born persons, percent, 2018-2022 | 17.2% |
| Housing | |
| Housing Units, July 1, 2023, (V2023) | X |
| Owner-occupied housing unit rate, 2018-2022 | 46.2% |
| Median value of owner-occupied housing units, 2018-2022 | $376,400 |
| Median selected monthly owner costs -with a mortgage, 2018-2022 | $2,050 |
| Median selected monthly owner costs -without a mortgage, 2018-2022 | $569 |
| Median gross rent, 2018-2022 | $1,372 |
| Building Permits, 2023 | X |
| Families & Living Arrangements | |
| Households, 2018-2022 | 24,403 |
| Persons per household, 2018-2022 | 2.39 |
| Living in same house 1 year ago, percent of persons age 1 year+, 2018-2022 | 79.1% |
| Language other than English spoken at home, percent of persons age 5 years+, 2018-2022 | 24.3% |
| Computer and Internet Use | |
| Households with a computer, percent, 2018-2022 | 97.2% |
| Households with a broadband Internet subscription, percent, 2018-2022 | 91.3% |
| Education | |
| High school graduate or higher, percent of persons age 25 years+, 2018-2022 | 88.5% |
| Bachelor’s degree or higher, percent of persons age 25 years+, 2018-2022 | 45.8% |
| Health | |
| With a disability, under age 65 years, percent, 2018-2022 | 6.7% |
| Persons without health insurance, under age 65 years, percent | 21.6% |
| Economy | |
| In civilian labor force, total, percent of population age 16 years+, 2018-2022 | 67.6% |
| In civilian labor force, female, percent of population age 16 years+, 2018-2022 | 61.1% |
| Total accommodation and food services sales, 2017 ($1,000)(c) | 282,938 |
| Total health care and social assistance receipts/revenue, 2017 ($1,000)(c) | 2,324,868 |
| Total transportation and warehousing receipts/revenue, 2017 ($1,000)(c) | 492,100 |
| Total retail sales, 2017 ($1,000)(c) | 2,099,654 |
| Total retail sales per capita, 2017(c) | $34,643 |
| Transportation | |
| Mean travel time to work (minutes), workers age 16 years+, 2018-2022 | 27.3 |
| Income & Poverty | |
| Median household income (in 2022 dollars), 2018-2022 | $67,589 |
| Per capita income in past 12 months (in 2022 dollars), 2018-2022 | $40,767 |
| Persons in poverty, percent | 12.8% |
| Businesses | |
| Total employer establishments, 2022 | X |
| Total employment, 2022 | X |
| Total annual payroll, 2022 ($1,000) | X |
| Total employment, percent change, 2021-2022 | X |
| Total nonemployer establishments, 2021 | X |
| All employer firms, Reference year 2017 | 3,152 |
| Men-owned employer firms, Reference year 2017 | 1,993 |
| Women-owned employer firms, Reference year 2017 | S |
| Minority-owned employer firms, Reference year 2017 | 505 |
| Nonminority-owned employer firms, Reference year 2017 | 2,146 |
| Veteran-owned employer firms, Reference year 2017 | 193 |
| Nonveteran-owned employer firms, Reference year 2017 | 2,443 |
| Geography | |
| Population per square mile, 2020 | 2,602.0 |
| Population per square mile, 2010 | 2,451.4 |
| Land area in square miles, 2020 | 23.43 |
| Land area in square miles, 2010 | 23.08 |
| FIPS Code | 1349756 |