Yesterday we asked the question: How prepared are Cobb County residents in the face of disaster? The U.S. Census Bureau has created a means of evaluating how prepared communities within Cobb County are to recover from catastrophic events.
In yesterday’s exploration of this tool, we focused on the census tracts in the county where the residents were most at risk for having a rough time recovering in case of a disaster.
Today we’ll examine those parts of the county that are most resilient in case of a disaster, and are best able to recover.
To figure out the ability of a community to recover the census bureau has created the Community Resilience Estimates.
Disasters can be anything from storms and floods to pandemics.
The Census Bureau introduction describes community resilience as follows:
Community resilience is the capacity of individuals and households to absorb, endure, and recover from the health, social, and economic impacts of a disaster such as a hurricane or pandemic. When disasters occur, recovery depends on the community’s ability to withstand the effects of the event. In order to facilitate disaster preparedness, the Census Bureau has developed new small area estimates, identifying communities where resources and information may effectively mitigate the impact of disasters.
The bureau also provides an interactive tool that you can use to determine how many risk factors the community you live in has on average, and you can look at the data down to the census tract level.
How does the Census Bureau determine ability to recover?
The way the ranking in the capacity to recover from a disaster is determined is by counting the number of risk factors from a list for individuals and households, and sorting them into those with no risk factors, those with 1 or 2 risk factors, and those with three or more risk factors.
Then the census bureau determines how many people or households are in each of those three categories for each census tract.
If that seems too confusing, just think of it as how many people in each census tract are prepared to deal with a disaster.
The risk factors, determined by data from the 2019 American Community Survey, include:
- Income to Poverty Ratio
- Single or Zero Caregiver Household
- Crowding
- Communication Barrier
- Households without Full-time, Year-round Employment
- Disability
- No Health Insurance
- Age 65+
- No Vehicle Access
- No Broadband Internet Access
In other words, if you are a person below the poverty level, with a disability, and no car, your ability to recover from something like a flooded house or COVID-19 would be less than someone who has none of the risk factors on that list.
How does Cobb County fare overall in capacity to recover?
How does Cobb County fare overall? 43.4 percent of Cobb’s population have no risk factors that hinder disaster recovery, 40.8 percent have 1 or 2 risk factors, and 15.9 percent have 3 or more risk factors that would make weathering and recovering a disaster more difficult.
Yesterday we focused on those census tracts that had three or more risk factors, making them the least able to recover.
Today we’ll examine the parts of the county with the most capacity to recover.
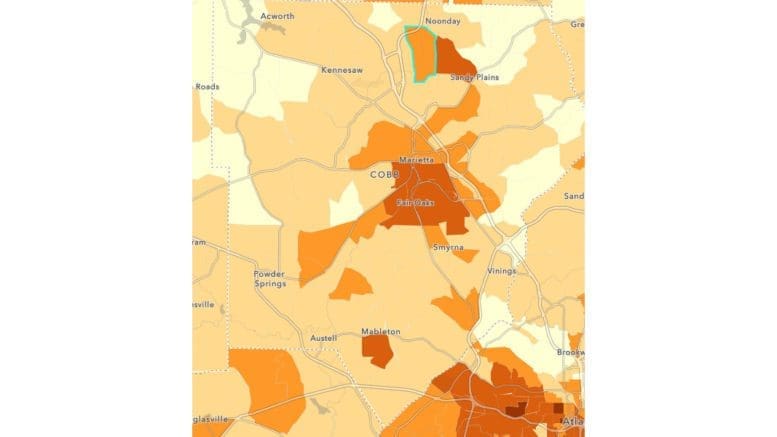
This screenshot of the map of Cobb County from the interactive tool displays so the darkest areas are the areas at the highest risk.
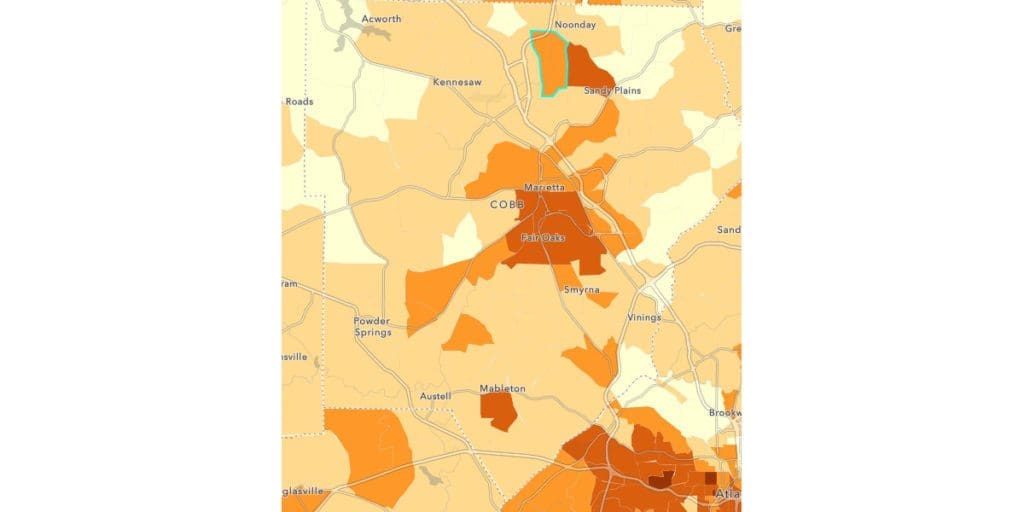
Not surprisingly, the areas with the best capacity for recovery are the northwest and northeast portions of Cobb County, plus Vinings. In other words, the more affluent parts of the county.
Census tracts with less than 10 percent of residents with 3 or more risk factors
| TRACT | percentage with 3 or more risk factors | Community |
| 30340 | 5.75 | East Cobb |
| 30222 | 6.08 | North Cobb between Bells Ferry/Wade Green |
| 30339 | 6.8 | North of Vinings by river |
| 30320 | 7.59 | East Cobb |
| 30327 | 7.85 | East Cobb |
| 30219 | 8.07 | Northwest Cobb |
| 30326 | 8.12 | East Cobb |
| 31205 | 8.3 | Between Vinings and Oakdale |
| 30214 | 8.36 | Northwest Cobb |
| 30336 | 8.55 | East Cobb |
| 30322 | 8.68 | East Cobb |
| 30233 | 8.89 | West Cobb |
| 30337 | 8.97 | East Cobb |
| 30344 | 9.01 | Powers Ferry area |
| 30238 | 9.17 | West Cobb |
| 30314 | 9.19 | East Cobb |
| 30341 | 9.2 | East Cobb |
| 30324 | 9.21 | East Cobb |
| 30234 | 9.31 | West Cobb |
| 30101 | 9.37 | Northwest Cobb |
| 30318 | 9.54 | East Cobb |
Complete list of tracts sorted from lowest risk to highest
| TRACT | percentage with 3 or more risk factors |
| 30340 | 5.75 |
| 30222 | 6.08 |
| 30339 | 6.8 |
| 30320 | 7.59 |
| 30327 | 7.85 |
| 30219 | 8.07 |
| 30326 | 8.12 |
| 31205 | 8.3 |
| 30214 | 8.36 |
| 30336 | 8.55 |
| 30322 | 8.68 |
| 30233 | 8.89 |
| 30337 | 8.97 |
| 30344 | 9.01 |
| 30238 | 9.17 |
| 30314 | 9.19 |
| 30341 | 9.2 |
| 30324 | 9.21 |
| 30234 | 9.31 |
| 30101 | 9.37 |
| 30318 | 9.54 |
| 31313 | 10.12 |
| 31208 | 10.18 |
| 30226 | 10.26 |
| 30333 | 10.33 |
| 30342 | 10.33 |
| 31117 | 10.62 |
| 30209 | 10.65 |
| 31211 | 10.74 |
| 31112 | 10.81 |
| 30107 | 10.97 |
| 30319 | 11.11 |
| 30343 | 11.11 |
| 30232 | 11.36 |
| 30335 | 11.39 |
| 30215 | 11.46 |
| 30224 | 11.46 |
| 30345 | 11.74 |
| 30228 | 12 |
| 30235 | 12 |
| 30236 | 12.04 |
| 30310 | 12.14 |
| 31209 | 12.17 |
| 30332 | 12.2 |
| 30220 | 12.31 |
| 30218 | 12.33 |
| 31505 | 12.47 |
| 30330 | 12.53 |
| 30331 | 12.62 |
| 31207 | 12.74 |
| 31405 | 12.86 |
| 31408 | 12.9 |
| 31508 | 13.26 |
| 31409 | 13.35 |
| 30901 | 13.41 |
| 30411 | 13.45 |
| 31005 | 13.54 |
| 30407 | 13.76 |
| 30311 | 13.78 |
| 30408 | 13.92 |
| 30328 | 13.97 |
| 30506 | 14.06 |
| 31113 | 14.39 |
| 30239 | 14.6 |
| 30334 | 14.68 |
| 31312 | 14.84 |
| 31307 | 15.08 |
| 31114 | 15.17 |
| 31110 | 15.32 |
| 30329 | 15.35 |
| 30230 | 15.39 |
| 31404 | 15.4 |
| 30601 | 15.5 |
| 30231 | 15.61 |
| 30106 | 15.71 |
| 30507 | 15.85 |
| 31212 | 15.95 |
| 30227 | 16.16 |
| 31309 | 16.2 |
| 30409 | 16.63 |
| 31506 | 16.65 |
| 30104 | 16.74 |
| 31108 | 17.12 |
| 31310 | 17.37 |
| 30229 | 17.56 |
| 31306 | 17.56 |
| 30223 | 17.59 |
| 31115 | 17.66 |
| 31118 | 17.79 |
| 30504 | 17.83 |
| 31004 | 18.22 |
| 31311 | 18.36 |
| 31509 | 18.88 |
| 30410 | 19.29 |
| 31106 | 19.64 |
| 31116 | 19.88 |
| 30103 | 19.97 |
| 31507 | 20.26 |
| 30502 | 20.91 |
| 30602 | 21.04 |
| 30413 | 21.96 |
| 30905 | 22.02 |
| 31406 | 22.08 |
| 31503 | 22.19 |
| 31111 | 22.74 |
| 30505 | 22.85 |
| 30405 | 24.54 |
| 30313 | 24.78 |
| 30412 | 25.14 |
| 31206 | 25.5 |
| 31101 | 26.04 |
| 30414 | 27.54 |
| 30700 | 29.01 |
| 30312 | 31.02 |
| 31002 | 32.78 |
| 30904 | 33.24 |
| 30902 | 35.7 |
| 30800 | 36.29 |
| 31001 | 36.47 |
| 31308 | 37.58 |