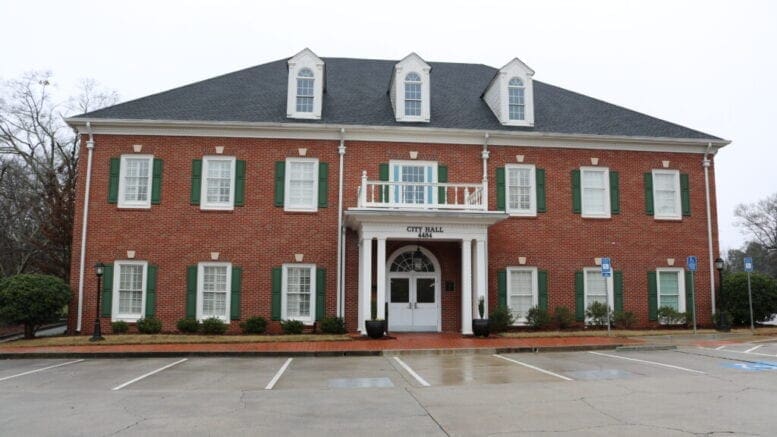
The City of Powder Springs posted the following announcement about a public meeting on the city’s future skate park:
Residents are invited to a virtual public meeting June 21 to learn about the city’s future skate park and ask questions regarding its planned design and features.
The meeting will begin no sooner than 7 p.m. and following the conclusion of the City Council’s meeting, which is scheduled for earlier in the evening.
The City of Powder Springs in April entered into a contract with California Skateparks to design and construct a skatepark, including removal and relocation of the existing climbing structure, within the Silver Comet Linear Park under the Special Purpose Local Option Sales Tax (SPLOST) program.
The meeting will be in the form of a Zoom webinar starting with presenters from California Skateparks and the city, with virtual attendees able to ask questions or offer comments during the Q&A session using Zoom features. It will also be viewable on Facebook Live, as well as through the city’s website as a streamed meeting. Zoom log-in info is below.
Agenda link for Powder Springs Skatepark Public Meeting No. 1
Topic: Powder Springs Skate Park – Public Meeting
Please click the link below to join the webinar:
https://us06web.zoom.us/j/82389027786?pwd=d2FUcUFsOGYwM29WVnBoMjcwTFhLZz09
Passcode: 359314
About the City of Powder Springs
The City of Powder Springs was incorporated in September of 1883.
The U.S. Census Bureau gives the following quick facts about the City of Powder Springs:
| Population Estimates, July 1 2021, (V2021) | 17,083 |
People
| Population | |
|---|---|
| Population Estimates, July 1 2021, (V2021) | 17,083 |
| Population estimates base, April 1, 2020, (V2021) | 16,901 |
| Population, percent change – April 1, 2020 (estimates base) to July 1, 2021, (V2021) | 1.1% |
| Population, Census, April 1, 2020 | 16,887 |
| Population, Census, April 1, 2010 | 13,940 |
| Age and Sex | |
| Persons under 5 years, percent | 6.6% |
| Persons under 18 years, percent | 24.3% |
| Persons 65 years and over, percent | 14.6% |
| Female persons, percent | 56.8% |
| Race and Hispanic Origin | |
| White alone, percent | 34.2% |
| Black or African American alone, percent(a) | 56.0% |
| American Indian and Alaska Native alone, percent(a) | 1.3% |
| Asian alone, percent(a) | 1.5% |
| Native Hawaiian and Other Pacific Islander alone, percent(a) | 0.0% |
| Two or More Races, percent | 2.9% |
| Hispanic or Latino, percent(b) | 14.7% |
| White alone, not Hispanic or Latino, percent | 29.5% |
| Population Characteristics | |
| Veterans, 2016-2020 | 1,356 |
| Foreign born persons, percent, 2016-2020 | 9.6% |
| Housing | |
| Housing units, July 1, 2021, (V2021) | |
| Owner-occupied housing unit rate, 2016-2020 | 80.1% |
| Median value of owner-occupied housing units, 2016-2020 | $181,000 |
| Median selected monthly owner costs -with a mortgage, 2016-2020 | $1,328 |
| Median selected monthly owner costs -without a mortgage, 2016-2020 | $453 |
| Median gross rent, 2016-2020 | $1,296 |
| Building permits, 2021 | |
| Families & Living Arrangements | |
| Households, 2016-2020 | 5,570 |
| Persons per household, 2016-2020 | 2.72 |
| Living in same house 1 year ago, percent of persons age 1 year+, 2016-2020 | 89.1% |
| Language other than English spoken at home, percent of persons age 5 years+, 2016-2020 | 15.2% |
| Computer and Internet Use | |
| Households with a computer, percent, 2016-2020 | 94.6% |
| Households with a broadband Internet subscription, percent, 2016-2020 | 91.1% |
| Education | |
| High school graduate or higher, percent of persons age 25 years+, 2016-2020 | 94.1% |
| Bachelor’s degree or higher, percent of persons age 25 years+, 2016-2020 | 39.4% |
| Health | |
| With a disability, under age 65 years, percent, 2016-2020 | 8.6% |
| Persons without health insurance, under age 65 years, percent | 9.4% |
| Economy | |
| In civilian labor force, total, percent of population age 16 years+, 2016-2020 | 67.6% |
| In civilian labor force, female, percent of population age 16 years+, 2016-2020 | 63.5% |
| Total accommodation and food services sales, 2012 ($1,000)(c) | 18,905 |
| Total health care and social assistance receipts/revenue, 2012 ($1,000)(c) | D |
| Total manufacturers shipments, 2012 ($1,000)(c) | 25,836 |
| Total retail sales, 2012 ($1,000)(c) | 141,070 |
| Total retail sales per capita, 2012(c) | $9,898 |
| Transportation | |
| Mean travel time to work (minutes), workers age 16 years+, 2016-2020 | 37.6 |
| Income & Poverty | |
| Median household income (in 2020 dollars), 2016-2020 | $72,810 |
| Per capita income in past 12 months (in 2020 dollars), 2016-2020 | $32,601 |
| Persons in poverty, percent | 6.3% |
Businesses
| Businesses | |
|---|---|
| All firms, 2012 | 1,775 |
| Men-owned firms, 2012 | 751 |
| Women-owned firms, 2012 | 838 |
| Minority-owned firms, 2012 | 1,009 |
| Nonminority-owned firms, 2012 | 726 |
| Veteran-owned firms, 2012 | 111 |
| Nonveteran-owned firms, 2012 | 1,547 |
Geography
| Geography | |
|---|---|
| Population per square mile, 2010 | 1,944.7 |
| Land area in square miles, 2010 | 7.17 |
| FIPS Code | 1362524 |
