Since July 4 will fall on a Monday this year, many Independence Day celebrations shifted their festivals, parades and fireworks displays to the weekend.
But Powder Springs decided to stick with the 4th.
The celebration is in Thurman Springs Park, and a press release describes the event as follows:
The City of Powder Springs is presenting its annual 4th of July Celebration complete with classic and modern cars, live bands, food vendors, arts and crafts vendors, a kids’ area, and of course, a fabulous fireworks show for the whole city to see.
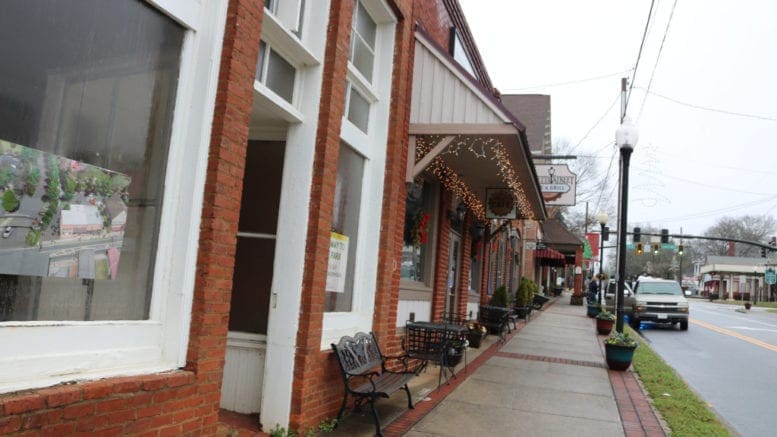
To be held downtown and within Thurman Springs Park (4485 Pineview Drive), festivities begin at 6 p.m. on Monday, July 4, with the fireworks show firing up at 9:30 p.m. The pyrotechnics will once again be shot from Powder Springs Park, giving attendees downtown and from many other parts of the city the chance to see the spectacular sparks. The event concludes at 10 p.m.
Kicking off the evening’s live music on the Hardy Family Automotive Amphitheater stage at 6 p.m. will be Boogie Down, a premier party band, performing pop to country, soul to jazz, Americana to Motown. Taking the stage around 8 p.m. will be Geek Squad, a Marietta-based band that will pump its high energy into Thurman Springs Park with its mix of Motown and Jazz to Funk, Hip Hop and today’s Top 40 hits.
The inaugural Powder Springs 4th of July Celebration Cruise-In, sponsored by Push Rods of Powder Springs, will allow owners of the area’s sweetest rides to put them on display downtown on Marietta Street. No registration fee is required, and owners can pre-register at cityofpowdersprings.org. Day-of-event registration will be 2 to 4:30 p.m. Vehicles must be driven to and from the event; no trailered vehicles allowed.
For more information on Powder Springs’ 4th of July Celebration, visit cityofpowdersprings.org.
About Powder Springs
The City of Powder Springs was incorporated in September of 1883.
The U.S. Census Bureau gives the following quick facts about the City of Powder Springs:
| Population | |
| Population Estimates, July 1 2021, (V2021) | 17,083 |
| Population estimates base, April 1, 2020, (V2021) | 16,901 |
| Population, percent change – April 1, 2020 (estimates base) to July 1, 2021, (V2021) | 1.1% |
| Population, Census, April 1, 2020 | 16,887 |
| Population, Census, April 1, 2010 | 13,940 |
| Age and Sex | |
| Persons under 5 years, percent | 6.6% |
| Persons under 18 years, percent | 24.3% |
| Persons 65 years and over, percent | 14.6% |
| Female persons, percent | 56.8% |
| Race and Hispanic Origin | |
| White alone, percent | 34.2% |
| Black or African American alone, percent(a) | 56.0% |
| American Indian and Alaska Native alone, percent(a) | 1.3% |
| Asian alone, percent(a) | 1.5% |
| Native Hawaiian and Other Pacific Islander alone, percent(a) | 0.0% |
| Two or More Races, percent | 2.9% |
| Hispanic or Latino, percent(b) | 14.7% |
| White alone, not Hispanic or Latino, percent | 29.5% |
| Population Characteristics | |
| Veterans, 2016-2020 | 1,356 |
| Foreign born persons, percent, 2016-2020 | 9.6% |
| Housing | |
| Owner-occupied housing unit rate, 2016-2020 | 80.1% |
| Median value of owner-occupied housing units, 2016-2020 | $181,000 |
| Median selected monthly owner costs -with a mortgage, 2016-2020 | $1,328 |
| Median selected monthly owner costs -without a mortgage, 2016-2020 | $453 |
| Median gross rent, 2016-2020 | $1,296 |
| Families & Living Arrangements | |
| Households, 2016-2020 | 5,570 |
| Persons per household, 2016-2020 | 2.72 |
| Living in same house 1 year ago, percent of persons age 1 year+, 2016-2020 | 89.1% |
| Language other than English spoken at home, percent of persons age 5 years+, 2016-2020 | 15.2% |
| Computer and Internet Use | |
| Households with a computer, percent, 2016-2020 | 94.6% |
| Households with a broadband Internet subscription, percent, 2016-2020 | 91.1% |
| Education | |
| High school graduate or higher, percent of persons age 25 years+, 2016-2020 | 94.1% |
| Bachelor’s degree or higher, percent of persons age 25 years+, 2016-2020 | 39.4% |
| Health | |
| With a disability, under age 65 years, percent, 2016-2020 | 8.6% |
| Persons without health insurance, under age 65 years, percent | 9.4% |
| Economy | |
| In civilian labor force, total, percent of population age 16 years+, 2016-2020 | 67.6% |
| In civilian labor force, female, percent of population age 16 years+, 2016-2020 | 63.5% |
| Total accommodation and food services sales, 2017 ($1,000)(c) | 29,526 |
| Total health care and social assistance receipts/revenue, 2017 ($1,000)(c) | 39,184 |
| Total transportation and warehousing receipts/revenue, 2017 ($1,000)(c) | 7,540 |
| Total retail sales, 2017 ($1,000)(c) | 181,543 |
| Total retail sales per capita, 2017(c) | $12,102 |
| Transportation | |
| Mean travel time to work (minutes), workers age 16 years+, 2016-2020 | 37.6 |
| Income & Poverty | |
| Median household income (in 2020 dollars), 2016-2020 | $72,810 |
| Per capita income in past 12 months (in 2020 dollars), 2016-2020 | $32,601 |
| Persons in poverty, percent | 6.3% |
| Businesses | |
| All employer firms, Reference year 2017 | 300 |
| Men-owned employer firms, Reference year 2017 | 134 |
| Nonminority-owned employer firms, Reference year 2017 | 170 |
| Nonveteran-owned employer firms, Reference year 2017 | 247 |
| Geography | |
| Population per square mile, 2020 | 2,288.5 |
| Population per square mile, 2010 | 1,944.7 |
| Land area in square miles, 2020 | 7.38 |
| Land area in square miles, 2010 |
| Population Estimates, July 1 2021, (V2021) | 17,083 |
