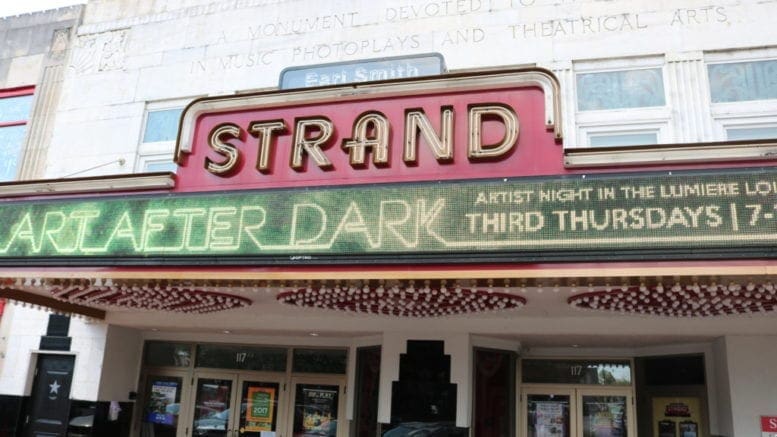
The musical comedy Smoke on the Mountain will come to Marietta’s Strand Theatre September 9 to 18, 2022.
According to promotional materials for the performances:
Rollicking, exhilarating, and charmingly funny, Smoke on the Mountain features two dozen rousing bluegrass gospel songs played and sung by the Sanders family. Set in North Carolina in 1938, Smoke on the Mountain follows the Sanders Family Singers’ comedy of errors as they perform at Mount Pleasant Baptist Church’s Saturday Night Gospel Sing and reveal their true – and hilariously imperfect – natures. Audiences will laugh, sing, and fall in love with the charming Sanders family in the show the New York Post called, “Totally beguiling… foot-stomping soul food.”
This production marks the return of the creative team behind The Strand’s popular 2019 production of Smoke on the Mountain and the recent Forever Plaid production in May.
For more information on the cast and production team, visit the announcement on the City of Marietta’s website.
For a complete schedule of performances of Smoke on the Mountain, and to purchase tickets, visit the following link.
About the City of Marietta
The City of Marietta is the county seat of Cobb County. The latest estimate from the U.S. Census Bureau puts the population of the city at 60,867 which makes it the largest city in Cobb County by population.
However, the city is in a neck-and-neck race with fast-growing Smyrna, whose population was 56,666 at the last estimate.
Here are a few fast facts from the Census Bureau
| Marietta city, Georgia | |
| People | |
| Population, Census, April 1, 2020 | 60972 |
| Population, Census, April 1, 2010 | 56579 |
| Age and Sex | |
| Persons under 5 years, percent | 6.7% |
| Persons under 18 years, percent | 21.8% |
| Persons 65 years and over, percent | 13.2% |
| Female persons, percent | 49.9% |
| Race and Hispanic Origin | |
| White alone, percent | 53.4% |
| Black or African American alone, percent(a) | 32.3% |
| American Indian and Alaska Native alone, percent(a) | 0.6% |
| Asian alone, percent(a) | 1.9% |
| Native Hawaiian and Other Pacific Islander alone, percent(a) | 0.0% |
| Two or More Races, percent | 4.7% |
| Hispanic or Latino, percent(b) | 15.7% |
| White alone, not Hispanic or Latino, percent | 46.4% |
| Population Characteristics | |
| Veterans, 2016-2020 | 2678 |
| Foreign born persons, percent, 2016-2020 | 16.6% |
| Housing | |
| Owner-occupied housing unit rate, 2016-2020 | 44.0% |
| Median value of owner-occupied housing units, 2016-2020 | $310,100 |
| Median selected monthly owner costs -with a mortgage, 2016-2020 | $1,856 |
| Median selected monthly owner costs -without a mortgage, 2016-2020 | $526 |
| Median gross rent, 2016-2020 | $1,145 |
| Families & Living Arrangements | |
| Households, 2016-2020 | 24148 |
| Persons per household, 2016-2020 | 2.39 |
| Living in same house 1 year ago, percent of persons age 1 year+, 2016-2020 | 77.9% |
| Language other than English spoken at home, percent of persons age 5 years+, 2016-2020 | 23.7% |
| Computer and Internet Use | |
| Households with a computer, percent, 2016-2020 | 95.1% |
| Households with a broadband Internet subscription, percent, 2016-2020 | 86.6% |
| Education | |
| High school graduate or higher, percent of persons age 25 years+, 2016-2020 | 88.6% |
| Bachelor’s degree or higher, percent of persons age 25 years+, 2016-2020 | 44.0% |
| Health | |
| With a disability, under age 65 years, percent, 2016-2020 | 6.3% |
| Persons without health insurance, under age 65 years, percent | 20.2% |
| Economy | |
| In civilian labor force, total, percent of population age 16 years+, 2016-2020 | 67.2% |
| In civilian labor force, female, percent of population age 16 years+, 2016-2020 | 61.2% |
| Total accommodation and food services sales, 2012 ($1,000)(c) | 264544 |
| Total health care and social assistance receipts/revenue, 2012 ($1,000)(c) | 1584232 |
| Total manufacturers shipments, 2012 ($1,000)(c) | 1129407 |
| Total retail sales, 2012 ($1,000)(c) | 1976915 |
| Total retail sales per capita, 2012(c) | $33,875 |
| Transportation | |
| Mean travel time to work (minutes), workers age 16 years+, 2016-2020 | 28.5 |
| Income & Poverty | |
| Median household income (in 2020 dollars), 2016-2020 | $59,594 |
| Per capita income in past 12 months (in 2020 dollars), 2016-2020 | $36,112 |
| Persons in poverty, percent | 14.1% |
| Businesses | |
| All firms, 2012 | 10501 |
| Men-owned firms, 2012 | 4934 |
| Women-owned firms, 2012 | 4186 |
| Minority-owned firms, 2012 | 4286 |
| Nonminority-owned firms, 2012 | 5502 |
| Veteran-owned firms, 2012 | 1015 |
| Nonveteran-owned firms, 2012 | 8663 |
| Geography | |
| Population per square mile, 2010 | 2451.4 |
| Land area in square miles, 2010 | 23.08 |