
This article will not only answer the questions in the article title, but will show you how to get that information and more yourself using the easy-to-use OnTheMap tool from the census.
This is another reworking and expansion of an earlier article in our Cobb County by the Numbers series, using data and tools from the U.S. Census Bureau. The tool we used from the census is updated with the 2021 ACS. Our previous version was for 2019.
The Courier is expanding its coverage of transportation, public transit, and commuting, and the way people currently commute is an important part of understanding what the options are for public policy around transportation.
After the Census Bureau began publishing results from the decennial census, and introduced a new set of easy-to-use tools for getting at the numbers, the Courier published a series of articles making use of the new tools.
Unfortunately, those articles were introduced when the COVID pandemic dominated the news, so the census articles languished with low traffic, even though the information was important to an informed citizenry.
This article uses the OnTheMap tool from the U.S. Census Bureau to sort out people who live in Cobb County but work in other counties, people who live in other counties but work in Cobb, and people who both live and work in the county.
The U.S. Census Bureau gathers those figures in their American Community Survey and provides tools that allow people to map, visualize and create tables and charts from that data. And it might surprise you to know how easy to use those tools are.
And they are surprisingly easy to use. Just follow this link to the OnTheMap tool, or scroll to the videos at the bottom of the article that instruct you on how to learn things about employment in any area of the U.S.
Have you ever wondered how many people work in Cobb County who live here? How about how many people live outside Cobb County and commute into the county to work? Or how many live in the county but travel to other counties for employment.
For videos from the Census Bureau explaining how to access and use those tools scroll to the bottom of this article.
A couple of caveats are necessary before we get to the point on what the commute flows look like in Cobb County. One is that gathering the data is time-consuming for the Census Bureau, so there is a time lag before sets of data become available. This article was written based on the 2021 ACS. We’ve swapped off the map from the previous version of this article, which used the 2019 figures.
The second is that the COVID pandemic affected both the gathering of the data, and the job market itself, although some economists don’t believe the market has been affected as severely as earlier news reports would indicate.
With those out of the way, let’s get right to the point.
Here’s a map of the inflow and outflow of commuting workers.
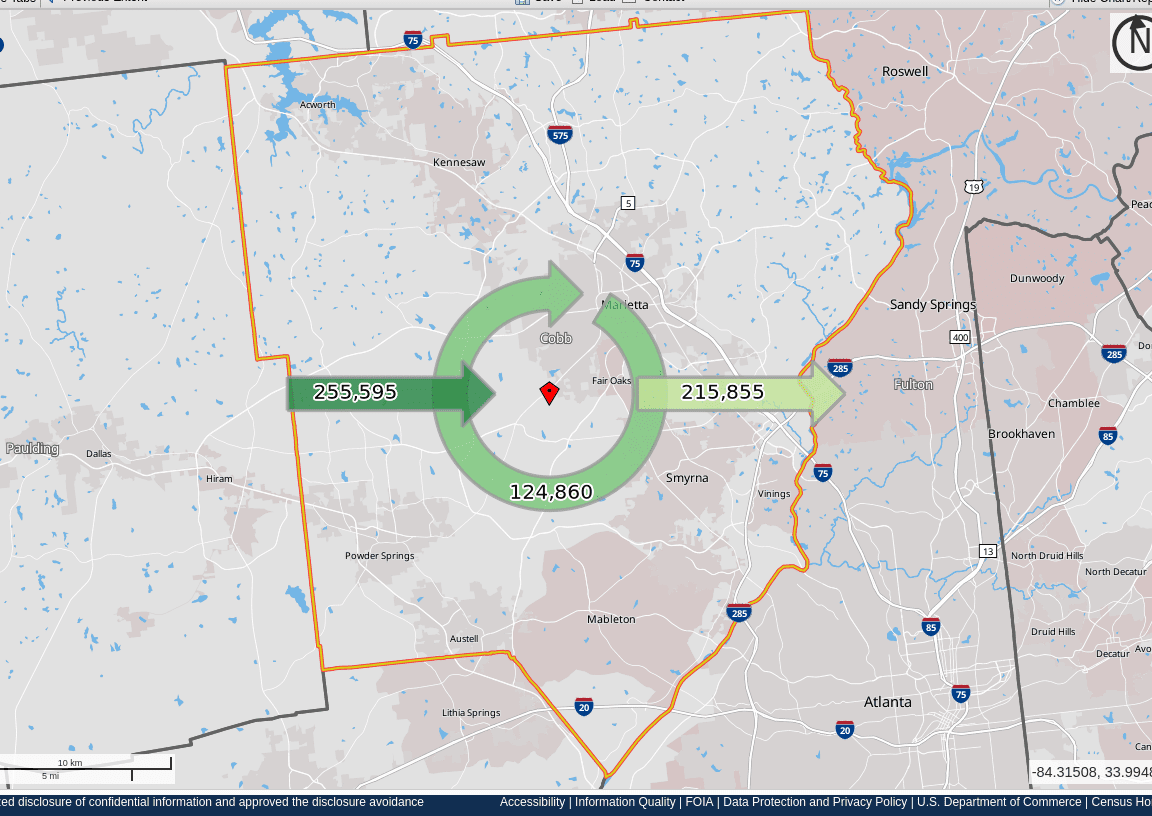
You can click on the map to make it larger and more readable, but the arrow on the left of the map represents workers who don’t live in the county commuting to Cobb County to work. That number as of the 2021 ACS stood at 255,595.
The arrow on the right represents the residents of Cobb County who commute outside of the county for their employment. That number stood at 215,851 when the last ACS data was made available.
At the bottom of the circular arrow is Cobb County residents who work in the county.
That number stood at 124,860 in the 2021 ACS.
More information on job flows in Cobb County
It might qualify as TMI (“too much information”) but you can get a more complete idea of the job flows by looking over the table below.
Note that the figure of 380,455 for “Employed in the Selection Area” is the non-Cobb residents who commute into the county plus the residents who work here.
And the 340,455 figure for “Living in the Selection Area” is not the total population, but an estimate of the workforce.
Inflow/Outflow Report
| Selection Area Labor Market Size (All Jobs) | ||
| 2021 | ||
| Count | Share | |
| Employed in the Selection Area | 380,455 | 100.0% |
| Living in the Selection Area | 340,715 | 89.6% |
| Net Job Inflow (+) or Outflow (-) | 39,740 | – |
| In-Area Labor Force Efficiency (All Jobs) | ||
| 2021 | ||
| Count | Share | |
| Living in the Selection Area | 340,715 | 100.0% |
| Living and Employed in the Selection Area | 124,860 | 36.6% |
| Living in the Selection Area but Employed Outside | 215,855 | 63.4% |
| In-Area Employment Efficiency (All Jobs) | ||
| 2021 | ||
| Count | Share | |
| Employed in the Selection Area | 380,455 | 100.0% |
| Employed and Living in the Selection Area | 124,860 | 32.8% |
| Employed in the Selection Area but Living Outside | 255,595 | 67.2% |
| Outflow Job Characteristics (All Jobs) | ||
| 2021 | ||
| Count | Share | |
| External Jobs Filled by Residents | 215,855 | 100.0% |
| Workers Aged 29 or younger | 47,052 | 21.8% |
| Workers Aged 30 to 54 | 122,970 | 57.0% |
| Workers Aged 55 or older | 45,833 | 21.2% |
| Workers Earning $1,250 per month or less | 36,351 | 16.8% |
| Workers Earning $1,251 to $3,333 per month | 49,318 | 22.8% |
| Workers Earning More than $3,333 per month | 130,186 | 60.3% |
| Workers in the “Goods Producing” Industry Class | 17,820 | 8.3% |
| Workers in the “Trade, Transportation, and Utilities” Industry Class | 47,537 | 22.0% |
| Workers in the “All Other Services” Industry Class | 150,498 | 69.7% |
| Inflow Job Characteristics (All Jobs) | ||
| 2021 | ||
| Count | Share | |
| Internal Jobs Filled by Outside Workers | 255,595 | 100.0% |
| Workers Aged 29 or younger | 60,191 | 23.5% |
| Workers Aged 30 to 54 | 141,893 | 55.5% |
| Workers Aged 55 or older | 53,511 | 20.9% |
| Workers Earning $1,250 per month or less | 46,670 | 18.3% |
| Workers Earning $1,251 to $3,333 per month | 71,892 | 28.1% |
| Workers Earning More than $3,333 per month | 137,033 | 53.6% |
| Workers in the “Goods Producing” Industry Class | 34,779 | 13.6% |
| Workers in the “Trade, Transportation, and Utilities” Industry Class | 60,770 | 23.8% |
| Workers in the “All Other Services” Industry Class | 160,046 | 62.6% |
| Interior Flow Job Characteristics (All Jobs) | ||
| 2021 | ||
| Count | Share | |
| Internal Jobs Filled by Residents | 124,860 | 100.0% |
| Workers Aged 29 or younger | 27,592 | 22.1% |
| Workers Aged 30 to 54 | 66,790 | 53.5% |
| Workers Aged 55 or older | 30,478 | 24.4% |
| Workers Earning $1,250 per month or less | 23,074 | 18.5% |
| Workers Earning $1,251 to $3,333 per month | 34,536 | 27.7% |
| Workers Earning More than $3,333 per month | 67,250 | 53.9% |
| Workers in the “Goods Producing” Industry Class | 15,081 | 12.1% |
| Workers in the “Trade, Transportation, and Utilities” Industry Class | 22,541 | 18.1% |
| Workers in the “All Other Services” Industry Class | 87,238 | 69.9% |
| Report Settings | |
| Analysis Type | Inflow/Outflow |
| Selection area as | N/A |
| Year(s) | 2021 |
| Job Type | All Jobs |
| Selection Area | Cobb County, GA from Counties |
| Selected Census Blocks | 7,680 |
| Analysis Generation Date | 12/31/2023 12:58 – OnTheMap 6.23.4 |
| Code Revision | b83319a02a70b14bc14ccfe9d9a4e81022acdb73 |
| LODES Data Vintage | 20231016_1512 |
| Selection Area Labor Market Size (All Jobs) | ||
| 2019 | ||
| Count | Share | |
| Employed in the Selection Area | 394,991 | 100.0% |
| Living in the Selection Area | 350,855 | 88.8% |
| Net Job Inflow (+) or Outflow (-) | 44,136 | – |
| In-Area Labor Force Efficiency (All Jobs) | ||
| 2019 | ||
| Count | Share | |
| Living in the Selection Area | 350,855 | 100.0% |
| Living and Employed in the Selection Area | 135,924 | 38.7% |
| Living in the Selection Area but Employed Outside | 214,931 | 61.3% |
| In-Area Employment Efficiency (All Jobs) | ||
| 2019 | ||
| Count | Share | |
| Employed in the Selection Area | 394,991 | 100.0% |
| Employed and Living in the Selection Area | 135,924 | 34.4% |
| Employed in the Selection Area but Living Outside | 259,067 | 65.6% |
| Outflow Job Characteristics (All Jobs) | ||
| 2019 | ||
| Count | Share | |
| External Jobs Filled by Residents | 214,931 | 100.0% |
| Workers Aged 29 or younger | 47,758 | 22.2% |
| Workers Aged 30 to 54 | 122,438 | 57.0% |
| Workers Aged 55 or older | 44,735 | 20.8% |
| Workers Earning $1,250 per month or less | 40,830 | 19.0% |
| Workers Earning $1,251 to $3,333 per month | 53,046 | 24.7% |
| Workers Earning More than $3,333 per month | 121,055 | 56.3% |
| Workers in the “Goods Producing” Industry Class | 18,265 | 8.5% |
| Workers in the “Trade, Transportation, and Utilities” Industry Class | 47,208 | 22.0% |
| Workers in the “All Other Services” Industry Class | 149,458 | 69.5% |
| Inflow Job Characteristics (All Jobs) | ||
| 2019 | ||
| Count | Share | |
| Internal Jobs Filled by Outside Workers | 259,067 | 100.0% |
| Workers Aged 29 or younger | 61,545 | 23.8% |
| Workers Aged 30 to 54 | 145,433 | 56.1% |
| Workers Aged 55 or older | 52,089 | 20.1% |
| Workers Earning $1,250 per month or less | 54,098 | 20.9% |
| Workers Earning $1,251 to $3,333 per month | 76,119 | 29.4% |
| Workers Earning More than $3,333 per month | 128,850 | 49.7% |
| Workers in the “Goods Producing” Industry Class | 34,384 | 13.3% |
| Workers in the “Trade, Transportation, and Utilities” Industry Class | 59,751 | 23.1% |
| Workers in the “All Other Services” Industry Class | 164,932 | 63.7% |