The Cobb County Branch of the NAACP is hosting the 20th Annual Juneteenth Celebration on Marietta Square, June 16-18, 2023.
According to the flyer for the event, the times of the celebration are Friday, June 16, 7 to 11 p.m., Saturday, June 17, 10 a.m. to 7 p.m., and Sunday, June 18, 2 to 6 p.m.
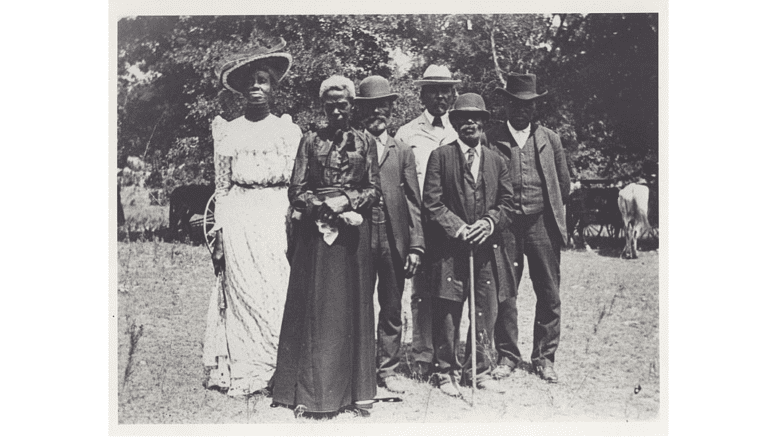
Juneteenth commemorates the official end of slavery in the United States and marks the day federal troops arrived in Galveston, Texas in 1865 to enforce the Emancipation Proclamation.
It recently a federal holiday in 2021, and is the longest-standing African American holiday.
Confederate General Robert E. Lee surrendered at Appomattox Court House in Virginia two months earlier, but slavery had remained relatively unaffected in Texas—until U.S. General Gordon Granger stood on Texas soil and read General Orders No. 3: “The people of Texas are informed that, in accordance with a proclamation from the Executive of the United States, all slaves are free.”
About the City of Marietta
The City of Marietta is the county seat of Cobb County. The latest estimate from the U.S. Census Bureau puts the population of the city at 60,867 which makes it the second largest city in Cobb County by population, smaller only than the newly incorporated City of Mableton.
Here are a few quick facts from the Census Bureau
| Marietta city, Georgia | |
| Population, Census, April 1, 2020 | 60972 |
| Population, Census, April 1, 2010 | 56579 |
| Age and Sex | |
| Persons under 5 years, percent | 6.7% |
| Persons under 18 years, percent | 21.8% |
| Persons 65 years and over, percent | 13.2% |
| Female persons, percent | 49.9% |
| Race and Hispanic Origin | |
| White alone, percent | 53.4% |
| Black or African American alone, percent(a) | 32.3% |
| American Indian and Alaska Native alone, percent(a) | 0.6% |
| Asian alone, percent(a) | 1.9% |
| Native Hawaiian and Other Pacific Islander alone, percent(a) | 0.0% |
| Two or More Races, percent | 4.7% |
| Hispanic or Latino, percent(b) | 15.7% |
| White alone, not Hispanic or Latino, percent | 46.4% |
| Population Characteristics | |
| Veterans, 2016-2020 | 2678 |
| Foreign born persons, percent, 2016-2020 | 16.6% |
| Housing | |
| Owner-occupied housing unit rate, 2016-2020 | 44.0% |
| Median value of owner-occupied housing units, 2016-2020 | $310,100 |
| Median selected monthly owner costs -with a mortgage, 2016-2020 | $1,856 |
| Median selected monthly owner costs -without a mortgage, 2016-2020 | $526 |
| Median gross rent, 2016-2020 | $1,145 |
| Families & Living Arrangements | |
| Households, 2016-2020 | 24148 |
| Persons per household, 2016-2020 | 2.39 |
| Living in same house 1 year ago, percent of persons age 1 year+, 2016-2020 | 77.9% |
| Language other than English spoken at home, percent of persons age 5 years+, 2016-2020 | 23.7% |
| Computer and Internet Use | |
| Households with a computer, percent, 2016-2020 | 95.1% |
| Households with a broadband Internet subscription, percent, 2016-2020 | 86.6% |
| Education | |
| High school graduate or higher, percent of persons age 25 years+, 2016-2020 | 88.6% |
| Bachelor’s degree or higher, percent of persons age 25 years+, 2016-2020 | 44.0% |
| Health | |
| With a disability, under age 65 years, percent, 2016-2020 | 6.3% |
| Persons without health insurance, under age 65 years, percent | 20.2% |
| Economy | |
| In civilian labor force, total, percent of population age 16 years+, 2016-2020 | 67.2% |
| In civilian labor force, female, percent of population age 16 years+, 2016-2020 | 61.2% |
| Total accommodation and food services sales, 2012 ($1,000)(c) | 264544 |
| Total health care and social assistance receipts/revenue, 2012 ($1,000)(c) | 1584232 |
| Total manufacturers shipments, 2012 ($1,000)(c) | 1129407 |
| Total retail sales, 2012 ($1,000)(c) | 1976915 |
| Total retail sales per capita, 2012(c) | $33,875 |
| Transportation | |
| Mean travel time to work (minutes), workers age 16 years+, 2016-2020 | 28.5 |
| Income & Poverty | |
| Median household income (in 2020 dollars), 2016-2020 | $59,594 |
| Per capita income in past 12 months (in 2020 dollars), 2016-2020 | $36,112 |
| Persons in poverty, percent | 14.1% |
| Businesses | |
| All firms, 2012 | 10501 |
| Men-owned firms, 2012 | 4934 |
| Women-owned firms, 2012 | 4186 |
| Minority-owned firms, 2012 | 4286 |
| Nonminority-owned firms, 2012 | 5502 |
| Veteran-owned firms, 2012 | 1015 |
| Nonveteran-owned firms, 2012 | 8663 |
| Geography | |
| Population per square mile, 2010 | 2451.4 |
| Land area in square miles, 2010 | 23.08 |