The Southern Museum in downtown Kennesaw will hold demonstrations of the day-to-day tasks of the home front and camp life during the Civil War.
The event is this Saturday, June 10, at 2829 Cherokee St NW, Kennesaw, GA 30144.
According to the press release:
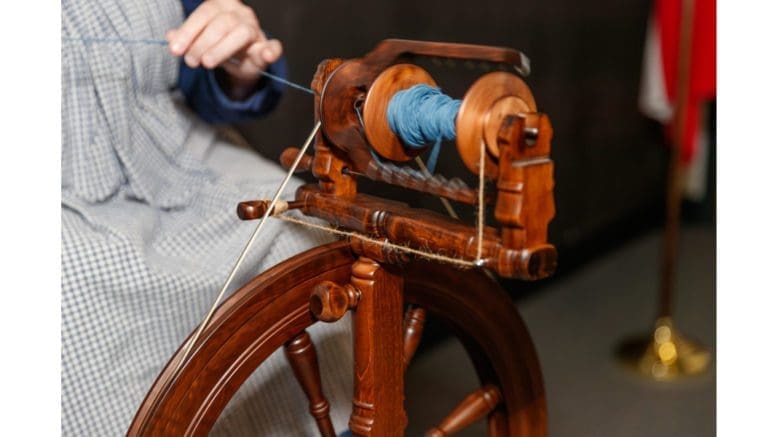
Interactive experiences for young visitors will include cornhusk doll making, laundering using a washboard and playing with Civil War-era toys. Living historians will demonstrate textile-making, leatherwork and soap making. The Reading Room will feature a display of artifacts from the Museum’s Collection.
Three Rivers Fife & Drum will have twenty-minute musical performances at 10:00 a.m., 12:00 p.m., and 3:00 p.m. Local Civil War historian Michael Shaffer will give two presentations: “Cobb County during the American Civil War” at 11:00 a.m. and “The History of Camp McDonald” at 2:00 p.m. Southern Museum Curator Joshua Whitfield will present “Labor Pains of a New South” at 1:00 p.m.
All activities are included with regular admission; $10 for adults, $8 for Seniors, and $5 for children. For further information, please visit www.SouthernMuseum.org.
About the City of Kennesaw
The City of Kennesaw was incorporated in 1887. With a population of 33,036 according to the recent decennial census, Kennesaw is the fourth-largest city in Cobb County, behind Mableton, Marietta and Smyrna. The US Census Bureau provides the following quick facts about the city:
| Population Estimates, July 1 2022, (V2022) | NA |
| Population Estimates, July 1 2021, (V2021) | 33,049 |
| Population | |
| Population Estimates, July 1 2022, (V2022) | NA |
| Population Estimates, July 1 2021, (V2021) | 33,049 |
| Population estimates base, April 1, 2020, (V2022) | NA |
| Population estimates base, April 1, 2020, (V2021) | 33,001 |
| Population, percent change – April 1, 2020 (estimates base) to July 1, 2022, (V2022) | NA |
| Population, percent change – April 1, 2020 (estimates base) to July 1, 2021, (V2021) | 0.1% |
| Population, Census, April 1, 2020 | 33,036 |
| Population, Census, April 1, 2010 | 29,783 |
| Age and Sex | |
| Persons under 5 years, percent | 6.0% |
| Persons under 18 years, percent | 22.3% |
| Persons 65 years and over, percent | 11.8% |
| Female persons, percent | 52.3% |
| Race and Hispanic Origin | |
| White alone, percent | 64.0% |
| Black or African American alone, percent(a) | 20.5% |
| American Indian and Alaska Native alone, percent(a) | 0.0% |
| Asian alone, percent(a) | 5.7% |
| Native Hawaiian and Other Pacific Islander alone, percent(a) | 0.0% |
| Two or More Races, percent | 6.7% |
| Hispanic or Latino, percent(b) | 14.9% |
| White alone, not Hispanic or Latino, percent | 55.7% |
| Population Characteristics | |
| Veterans, 2017-2021 | 2,071 |
| Foreign born persons, percent, 2017-2021 | 14.9% |
| Housing | |
| Housing units, July 1, 2021, (V2021) | X |
| Owner-occupied housing unit rate, 2017-2021 | 68.8% |
| Median value of owner-occupied housing units, 2017-2021 | $225,500 |
| Median selected monthly owner costs -with a mortgage, 2017-2021 | $1,600 |
| Median selected monthly owner costs -without a mortgage, 2017-2021 | $434 |
| Median gross rent, 2017-2021 | $1,470 |
| Building permits, 2021 | X |
| Families & Living Arrangements | |
| Households, 2017-2021 | 12,799 |
| Persons per household, 2017-2021 | 2.57 |
| Living in same house 1 year ago, percent of persons age 1 year+, 2017-2021 | 82.9% |
| Language other than English spoken at home, percent of persons age 5 years+, 2017-2021 | 21.8% |
| Computer and Internet Use | |
| Households with a computer, percent, 2017-2021 | 97.1% |
| Households with a broadband Internet subscription, percent, 2017-2021 | 95.8% |
| Education | |
| High school graduate or higher, percent of persons age 25 years+, 2017-2021 | 93.5% |
| Bachelor’s degree or higher, percent of persons age 25 years+, 2017-2021 | 44.7% |
| Health | |
| With a disability, under age 65 years, percent, 2017-2021 | 5.9% |
| Persons without health insurance, under age 65 years, percent | 14.2% |
| Economy | |
| In civilian labor force, total, percent of population age 16 years+, 2017-2021 | 70.6% |
| In civilian labor force, female, percent of population age 16 years+, 2017-2021 | 67.4% |
| Total accommodation and food services sales, 2017 ($1,000)(c) | 188,701 |
| Total health care and social assistance receipts/revenue, 2017 ($1,000)(c) | 142,150 |
| Total transportation and warehousing receipts/revenue, 2017 ($1,000)(c) | 99,548 |
| Total retail sales, 2017 ($1,000)(c) | 1,186,810 |
| Total retail sales per capita, 2017(c) | $34,676 |
| Transportation | |
| Mean travel time to work (minutes), workers age 16 years+, 2017-2021 | 31.5 |
| Income & Poverty | |
| Median household income (in 2021 dollars), 2017-2021 | $73,977 |
| Per capita income in past 12 months (in 2021 dollars), 2017-2021 | $37,608 |
| Persons in poverty, percent | 13.5% |
| Businesses | |
| Total employer establishments, 2020 | X |
| Total employment, 2020 | X |
| Total annual payroll, 2020 ($1,000) | X |
| Total employment, percent change, 2019-2020 | X |
| Total nonemployer establishments, 2019 | X |
| All employer firms, Reference year 2017 | 1,282 |
| Men-owned employer firms, Reference year 2017 | 665 |
| Women-owned employer firms, Reference year 2017 | 296 |
| Minority-owned employer firms, Reference year 2017 | S |
| Nonminority-owned employer firms, Reference year 2017 | 757 |
| Veteran-owned employer firms, Reference year 2017 | 54 |
| Nonveteran-owned employer firms, Reference year 2017 | 972 |
| Geography | |
| Population per square mile, 2020 | 3,400.2 |
| Population per square mile, 2010 | 3,155.1 |
| Land area in square miles, 2020 | 9.72 |
| Land area in square miles, 2010 | 9.44 |
| FIPS Code | 1343192 |