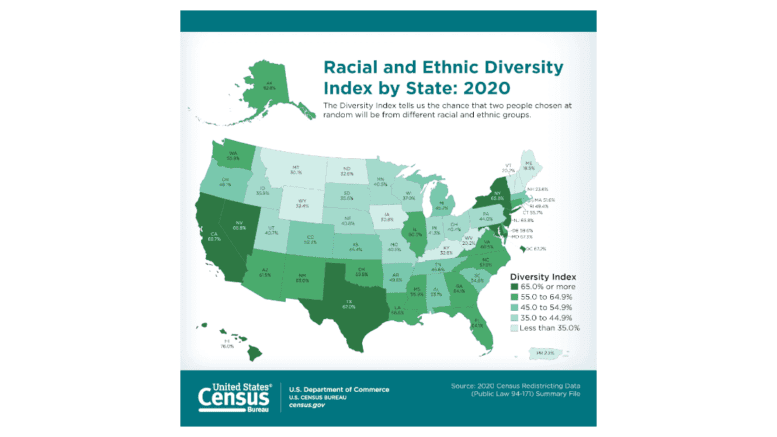
[The redistricting data from the 2020 census was released in easier-to-use format by the U.S. Census Bureau on September 16. The Courier believes that knowing your county is an important part of being an active citizen, and will regularly report different aspects of the make-up of our county]
The intense fight over redistricting, otherwise known as gerrymandering, is beginning in Georgia, and it will have a direct impact on most of our elected positions here in Cobb County, from the state senate seats to the school board.
The U.S. Census Bureau released the data that legislators will use to draw the districts in an easy-to-use format.
Not only can you tell what demographic changes have happened county-wide, but you can get a snapshot of the current population at the census tract level, and can build color-coded maps that tell you a lot about not only how the overall population figures are distributed, but about other demographic factors and how they are distributed throughout the county.
“Topics in both formats (spreadsheet and interactive tables) include 2020 Census population counts by race, Hispanic origin, voting age and housing unit data for counties, places, census tracts and blocks,” the Census Bureau wrote in its press release on September 16.
“We are excited to be able to provide these data to the public in a format that’s easier to use,” said acting Census Bureau Director Ron Jarmin.
What is available and how do you get to it?
Here is an excerpt from the Census Bureau’s announcement that point you to resources, including helpful tutorial videos:
Accessing Statistics on Data.census.gov
This is the first 2020 Census data release available on the Census Bureau’s data dissemination platform, data.census.gov. The site allows data users to search geographies down to the block level and access data through tables, maps and downloads. Data users can also access a geography, such as a state, county or place, in a geographic profile with visualizations and infographics to provide an overview on a specific area.
Features of data.census.gov include:
- Data tables: Users can select geographies, sort by topic, or add any other applicable filters. Data can be reordered, pinned, and hidden with drag and drop functionality. Included are the following tables:
- P1. Race
- P2. Hispanic or Latino, and Not Hispanic or Latino by Race
- P3. Race for the Population 18 Years and Over
- P4. Hispanic or Latino, and Not Hispanic or Latino by Race for the Population 18 Years and Over
- P5. Group Quarters Population by Major Group Quarters Type
- H1. Occupancy Status
- Mapping: Data users can display data across collections of geographies in a thematic map for a more visual representation.
- Data downloads: Users can download multiple tables for 2020 and 2010 censuses at the same time for easier reference.
Instructional videos on accessing 2020 Census redistricting data are available on the data.census.gov resources page and include videos on accessing population counts, census blocks, mapping geographies, customizing the table view, and comparing 2020 and 2010 census data. Additional tutorials and materials on how to access data on data.census.gov, including a webinar scheduled Sept. 21, are available on Census Academy.
Additional information about the Redistricting Data Program, including data visualizations for the nation, state, county and metropolitan/micropolitan statistical areas is available in the 2020 Census Redistricting Files Press Kit. More information on the redistricting data program is also available on the 2020 Census P.L. 94-171 Redistricting Data Summary Files webpage.
