
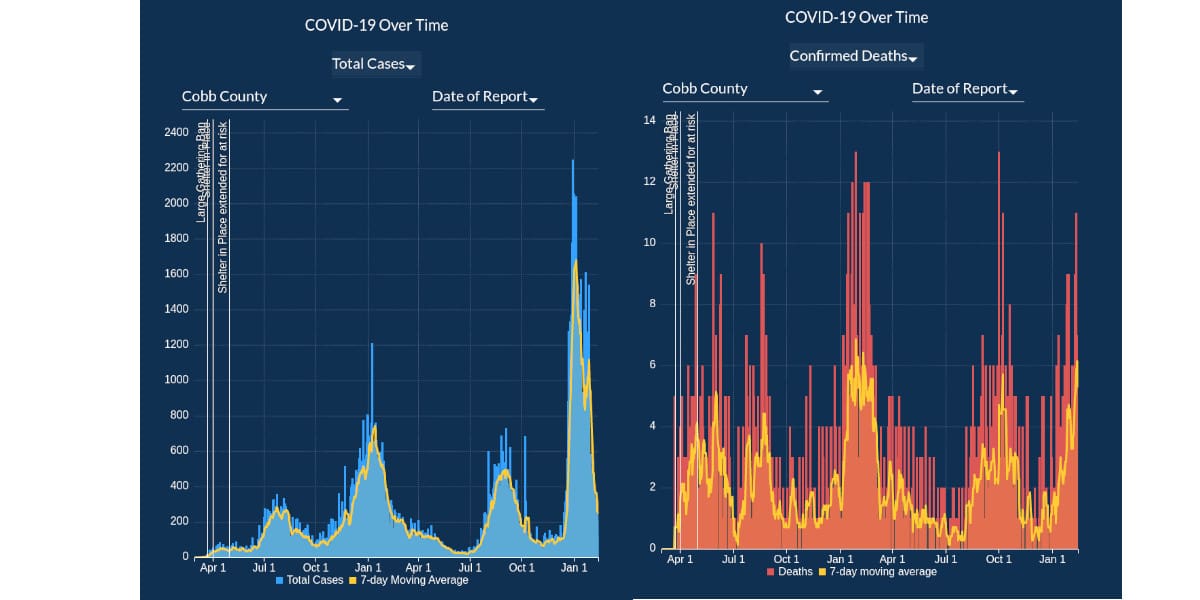
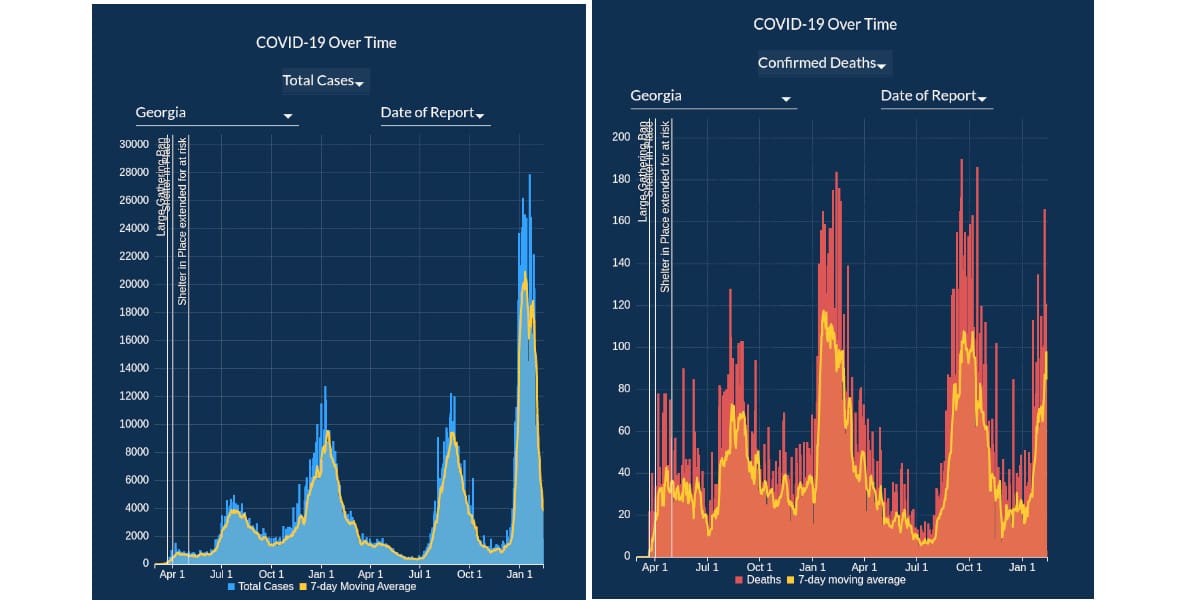
The 7-day moving average of COVID cases in Cobb County and the 7-day moving average of deaths from COVID have been moving in opposite directions since mid-January in Cobb County and statewide.
This has been a national trend and has been reported as due to the time lag between the onset of the illness and death.
The charts below give visual images of the trends for Cobb County and statewide, but for larger and interactive versions of the charts, visit the COVID Daily Status Report. The yellow lines represent the 7-day moving averages.
The numbers in this report were taken from the Georgia Department of Public Health COVID Daily Status Report, from the summary posted on the CDC County View data tracker, and from the Georgia Hospital Bed and Ventilator use report.
Cobb County numbers
The Georgia Department of Public Health displays its COVID statistics based on 14-day blocks.
New cases in Cobb over the past 14 days: 3,474
14-day case rate per 100,000 of population: 439
Number of Cases in Cobb since the pandemic began: 132,319
Cases per 100,000 of population since the pandemic began: 16,737
Cobb numbers and rate from the CDC County View
The Centers for Disease Control and Prevention (CDC) gets its numbers from the Georgia Department of Public Health, but presents them in 7-day blocks rather than the 14-day blocks presented by the GDPH.
7-day Metrics
| Cases | 2,203 |
| Case Rate per 100k | 289.81 |
| % Positivity | 11.73% |
| Deaths | 42 |
| % of population ≥ 5 years of age fully vaccinated | 60.8% |
| New Hospital Admissions | 187 |
7-day percentage change
| Cases | -31.99% |
| % Positivity | -4.28% |
| Deaths | 75% |
| % of population ≥ 5 years of age fully vaccinated | N/A |
| New Hospital Admissions | -20.43% |
Statewide numbers
Reported Today
| Confirmed Cases | Antigen Positive Cases | Confirmed Deaths | Hospitalizations |
|---|---|---|---|
| 4,837 | 1,941 | 124 | 329 |
Hospital bed and ventilator report
Region N which includes Cherokee, Cobb, Douglas and Paulding counties, has:
1,130 general inpatientbeds in use out of 1,334 total beds, or 84.71%
170 ICU beds in use out of a total of 198 total ICU beds, or 85.86%.
146 ED beds in use out of 296 total beds, or 49.32%
113 ventilators in use out of 192 total ventilators, or 58.85%
18.9% of patients in Region N are classified as COVID-19 patients.
For more information on COVID in Cobb County and statewide
Cobb & Douglas Public Health runs the case rate on their home page, although it is not updated frequently.
Visit the Cobb & Douglas Public Health home page by following this link
A more frequently updated summary of the statistics on COVID for Cobb County is the CDC’s County View page for Cobb County. The numbers come from the Georgia Department of Public Health but are displayed in a much easier-to-read way than the sprawling GDPH website. From this page you can get the one-week figures on the number of new cases, case rate per 100,000 of population, hospitalizations, deaths, and the percentage change from the previous 7-day period. It also includes data on testing and vaccination rates.
Visit the CDC County View page for Cobb County by following this link
The Georgia Department of Public Health publishes a daily status report on the pandemic every afternoon at around 3 p.m. It’s a comprehensive report with extensive data and charts arranged statewide and by county, that also includes age breakdowns, racial demographics, and data on vaccination and testing.
It isn’t the easiest system to navigate, but it’s worth spending time learning how to use if you’re interested in getting the latest statewide and local data on the state of COVID-19.
Visit the Georgia Department of Public Health Daily Status Report by following this link
To get an overview of how much the pandemic is stressing the hospital systems in terms of ER visits, hospital bed capacity, and ventilator use, there is a Hospital Bed and Ventilator Use report with interactive maps. The map is organized by hospital region, and Cobb County is part of Region N.
Visit the Georgia Hospital Beds and Ventilator Report by following this link
To get data on what percentage of patients in Georgia hospitals were admitted for COVID-19 versus all other causes, there is a Georgia Medical Facility Patient Census. It also reports numbers by statewide and hospital region.
Visit the Georgia Medical Facility Patient Census by following this link