Have you ever wondered how many people work in Cobb County who live here? How about how many people live outside Cobb County and commute into the county to work? Or how many live in the county but travel to other counties for employment.
The U.S. Census Bureau gathers those figures in their American Community Survey and provides tools that allow people to map, visualize and create tables and charts from that data.
And they are surprisingly easy to use.
For videos from the Census Bureau explaining how to access and use those tools scroll to the bottom of this article.
A couple of caveats are necessary before we get to the point on what the commute flows look like in Cobb County. One is that gathering the data is time-consuming for the Census Bureau, so there is a time lag before sets of data become available. This article was written based on the 2019 ACS.
The second is that the COVID pandemic affected both the gathering of the data, and the job market itself, although some economists don’t believe the market has been affected as severely as earlier news reports would indicate.
With those out of the way, let’s get right to the point.
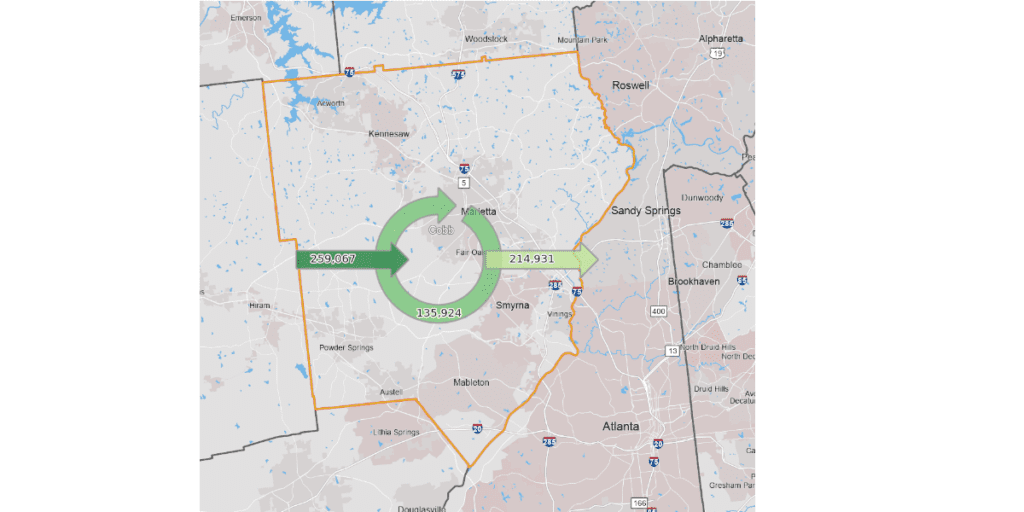
Here’s a map of the inflow and outflow of commuting workers.

You can click on the map to make it larger and more readable, but the arrow on the left of the map represents workers who don’t live in the county commuting to Cobb County to work. That number as of the 2019 ACS stood at 259,067.
The arrow on the right represents the residents of Cobb County who commute outside of the county for their employment. That number stood at 214,931 when the last ACS data was made available.
At the bottom of the circular arrow is Cobb County residents who work in the county.
That number stood at 135,924.
More information on job flows in Cobb County
It might qualify as TMI (“too much information”) but you can get a more complete idea of the job flows by looking over the table below.
Note that the figure of 394,991 for “Employed in the Selection Area” is the non-Cobb residents who commute into the county plus the residents who work here.
And the 350,855 figure for “Living in the Selection Area” is not the total population, but an estimate of the workforce.
Inflow/Outflow Report
| Selection Area Labor Market Size (All Jobs) | ||
| 2019 | ||
| Count | Share | |
| Employed in the Selection Area | 394,991 | 100.0% |
| Living in the Selection Area | 350,855 | 88.8% |
| Net Job Inflow (+) or Outflow (-) | 44,136 | – |
| In-Area Labor Force Efficiency (All Jobs) | ||
| 2019 | ||
| Count | Share | |
| Living in the Selection Area | 350,855 | 100.0% |
| Living and Employed in the Selection Area | 135,924 | 38.7% |
| Living in the Selection Area but Employed Outside | 214,931 | 61.3% |
| In-Area Employment Efficiency (All Jobs) | ||
| 2019 | ||
| Count | Share | |
| Employed in the Selection Area | 394,991 | 100.0% |
| Employed and Living in the Selection Area | 135,924 | 34.4% |
| Employed in the Selection Area but Living Outside | 259,067 | 65.6% |
| Outflow Job Characteristics (All Jobs) | ||
| 2019 | ||
| Count | Share | |
| External Jobs Filled by Residents | 214,931 | 100.0% |
| Workers Aged 29 or younger | 47,758 | 22.2% |
| Workers Aged 30 to 54 | 122,438 | 57.0% |
| Workers Aged 55 or older | 44,735 | 20.8% |
| Workers Earning $1,250 per month or less | 40,830 | 19.0% |
| Workers Earning $1,251 to $3,333 per month | 53,046 | 24.7% |
| Workers Earning More than $3,333 per month | 121,055 | 56.3% |
| Workers in the “Goods Producing” Industry Class | 18,265 | 8.5% |
| Workers in the “Trade, Transportation, and Utilities” Industry Class | 47,208 | 22.0% |
| Workers in the “All Other Services” Industry Class | 149,458 | 69.5% |
| Inflow Job Characteristics (All Jobs) | ||
| 2019 | ||
| Count | Share | |
| Internal Jobs Filled by Outside Workers | 259,067 | 100.0% |
| Workers Aged 29 or younger | 61,545 | 23.8% |
| Workers Aged 30 to 54 | 145,433 | 56.1% |
| Workers Aged 55 or older | 52,089 | 20.1% |
| Workers Earning $1,250 per month or less | 54,098 | 20.9% |
| Workers Earning $1,251 to $3,333 per month | 76,119 | 29.4% |
| Workers Earning More than $3,333 per month | 128,850 | 49.7% |
| Workers in the “Goods Producing” Industry Class | 34,384 | 13.3% |
| Workers in the “Trade, Transportation, and Utilities” Industry Class | 59,751 | 23.1% |
| Workers in the “All Other Services” Industry Class | 164,932 | 63.7% |
| Interior Flow Job Characteristics (All Jobs) | ||
| 2019 | ||
| Count | Share | |
| Internal Jobs Filled by Residents | 135,924 | 100.0% |
| Workers Aged 29 or younger | 31,079 | 22.9% |
| Workers Aged 30 to 54 | 73,106 | 53.8% |
| Workers Aged 55 or older | 31,739 | 23.4% |
| Workers Earning $1,250 per month or less | 29,103 | 21.4% |
| Workers Earning $1,251 to $3,333 per month | 40,233 | 29.6% |
| Workers Earning More than $3,333 per month | 66,588 | 49.0% |
| Workers in the “Goods Producing” Industry Class | 15,511 | 11.4% |
| Workers in the “Trade, Transportation, and Utilities” Industry Class | 25,155 | 18.5% |
| Workers in the “All Other Services” Industry Class | 95,258 | 70.1% |
