
The National Weather Service reports that metro Atlanta temperatures this winter were the fourth warmest on record, reaching a winter average of a 5.4 degrees departure from normal (DFN) (in other words the winter was on average 5.4 degrees F higher than the norm for December to February).
The DFN is based on what is called “climatic normal.”
Climatologists use the average conditions in the period between 1991 and 2020 to decide the norm for a region. Before 2021 the norm was based on 1981 to 2010.
Here is a table with Georgia’s winter climate report on temperatures.
| Winter 2021-22 Temperature Climate Statistics | |||
| Climate Site | Average Temperature (°F) | Normal Temperature (°F) | DFN (Departure From Normal) |
| Athens | 49.8 | 45.4 | +4.4 |
| Atlanta | 50.7 | 45.3 | +5.4 |
| Columbus | 53.0 | 49.1 | +3.9 |
| Macon | 52.7 | 48.1 | +4.6 |
| Cartersville | 45.1 | 42.8 | +2.3 |
| Dekalb Peachtree Arpt | 48.6 | 44.2 | +4.4 |
| Fulton County Arpt | 48.8 | 44.7 | +4.1 |
| Gainesville | 48.4 | 43.6 | +4.8 |
| Peachtree City | 50.0 | 44.6 | +5.4 |
| Rome | 48.3 | 42.7 | +5.6 |
Here are the rankings in various parts of the state:
| Winter 2021-22 Average Temperature Ranking & Records | |||
| Climate Site | Avg Temp Rank | Highest Avg Temp Record (°F) (year) | Lowest Avg Temp Record (°F) (year) |
| Athens | 3rd Warmest | 51.2 (2016-17) | 38.5 (1976-77) |
| Atlanta | 4th Warmest | 52.3 (2016-17) | 37.0 (1976-77) |
| Columbus | 12th Warmest | 54.8 (1949-50) | 42.8 (1976-77) |
| Macon | 7th Warmest | 55.3 (1948-49) | 43.0 (1976-77) |
To read more about the winter climate report in the metro area, including average precipitation and average high and low temperatures, visit the NWS Winter 2021-2022 climate report.
March 2022 climate summary for Atlanta area
The warming trend reported in the climate summary for winter continued into March, as reported in this table:
| Date | High | Low | Average | Departure from norm | Precipitation |
| 2022-03-01 | 69 | 42 | 55.5 | 3.6 | 0.00 |
| 2022-03-02 | 78 | 47 | 62.5 | 10.3 | 0.00 |
| 2022-03-03 | 80 | 51 | 65.5 | 13.1 | 0.00 |
| 2022-03-04 | 77 | 53 | 65.0 | 12.3 | 0.00 |
| 2022-03-05 | 78 | 51 | 64.5 | 11.6 | 0.00 |
| 2022-03-06 | 80 | 58 | 69.0 | 15.8 | 0.00 |
| 2022-03-07 | 75 | 55 | 65.0 | 11.6 | 0.15 |
| 2022-03-08 | 55 | 46 | 50.5 | -3.2 | 1.16 |
| 2022-03-09 | 57 | 49 | 53.0 | -0.9 | 0.45 |
| 2022-03-10 | 68 | 46 | 57.0 | 2.8 | 0.00 |
| 2022-03-11 | 59 | 48 | 53.5 | -0.9 | T |
| 2022-03-12 | 54 | 28 | 41.0 | -13.6 | 1.07 |
| 2022-03-13 | 55 | 25 | 40.0 | -14.9 | 0.00 |
| 2022-03-14 | 66 | 37 | 51.5 | -3.6 | 0.00 |
| 2022-03-15 | 68 | 48 | 58.0 | 2.6 | 0.32 |
| 2022-03-16 | 65 | 53 | 59.0 | 3.4 | 0.97 |
| 2022-03-17 | 74 | 49 | 61.5 | 5.6 | 0.00 |
| 2022-03-18 | 60 | 53 | 56.5 | 0.4 | 0.77 |
| 2022-03-19 | 67 | 48 | 57.5 | 1.2 | T |
| 2022-03-20 | 69 | 41 | 55.0 | -1.6 | 0.00 |
| 2022-03-21 | 73 | 44 | 58.5 | 1.7 | 0.00 |
| 2022-03-22 | 76 | 51 | 63.5 | 6.4 | T |
| 2022-03-23 | 77 | 58 | 67.5 | 10.2 | 0.52 |
| 2022-03-24 | 68 | 46 | 57.0 | -0.5 | 0.00 |
| 2022-03-25 | 63 | 47 | 55.0 | -2.8 | 0.00 |
| 2022-03-26 | 65 | 46 | 55.5 | -2.5 | 0.00 |
| 2022-03-27 | 65 | 43 | 54.0 | -4.3 | 0.00 |
| 2022-03-28 | 67 | 42 | 54.5 | -4.0 | 0.00 |
| 2022-03-29 | 75 | 51 | 63.0 | 4.3 | 0.00 |
| 2022-03-30 | 83 | 55 | 69.0 | 10.0 | 0.00 |
| 2022-03-31 | 73 | 53 | 63.0 | 3.8 | 0.65 |
| Sum | 2139 | 1464 | – | – | 6.06 |
|---|---|---|---|---|---|
| Average | 69.0 | 47.2 | 58.1 | 2.5 | – |
| Normal | 65.9 | 45.3 | 55.6 | – | 4.68 |
What is the difference between weather and climate?
Climate is not weather and weather is not climate, although they certainly affect one another.
Weather is what is occurring in the atmosphere at a given specific moment.
The National Weather Service glossary defines weather this way:
The state of the atmosphere with respect to wind, temperature, cloudiness, moisture, pressure, etc. Weather refers to these conditions at a given point in time (e.g., today’s high temperature), whereas Climate refers to the “average” weather conditions for an area over a long period of time (e.g., the average high temperature for today’s date).
Climate, on the other hand, is the behavior of weather over time. Take as an example the statements “Today’s high temperature was three degrees higher than normal,” or “This is a record rainfall for the month of April.”
Both those are statements about the area’s climate.
The National Weather Service glossary defines climate succinctly:
The composite or generally prevailing weather conditions of a region, throughout the year, averaged over a series of years.
The JetStream series of NWS tutorials puts in in a bit more conversational terms:
Time is the basic difference between climate and weather. When one averages the weather (maximum temperature, minimum temperature, wind speed and direction, rainfall, etc.) for any place, for any day, over a fixed number of years, that determines the average weather experienced, for that day, at that location.
Is the Earth warming, and is it due to human activity?
The answer to the question above is a resounding “yes!” This is the strong consensus in the scientific community.
An article by David Herring, program manager of the National Oceanic and Atmospheric Administration, opens with this answer to the question.
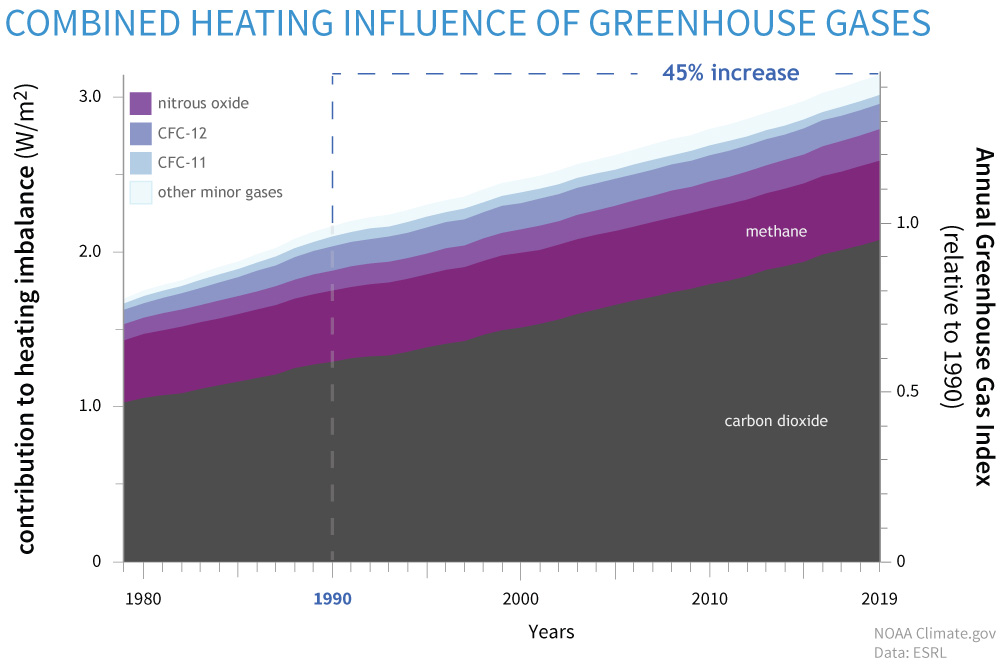
Yes, by increasing the abundance of greenhouse gases in the atmosphere, human activities are amplifying Earth’s natural greenhouse effect. Virtually all climate scientists agree that this increase in heat-trapping gases is the main reason for the 1.8°F (1.0°C) rise in global average temperature since the late nineteenth century. Carbon dioxide, methane, nitrous oxide, ozone, and various chlorofluorocarbons are all human-emitted heat-trapping gases. Among these, carbon dioxide is of greatest concern to scientists because it exerts a larger overall warming influence than the other gases combined.
About the National Weather Service
The National Weather Service (NWS) is a part of the National Oceanic and Atmospheric Administration (NOAA).
The NWS describes its role as follows:
The National Weather Service (NWS) provides weather, water, and climate forecasts and warnings for the United States, its territories, adjacent waters and ocean areas, for the protection of life and property and the enhancement of the national economy. These services include Forecasts and Observations, Warnings, Impact-based Decision Support Services, and Education in an effort to build a Weather-Ready Nation. The ultimate goal is to have a society that is prepared for and responds to weather, water and climate events.
Read all the Cobb County Courier climate and weather coverage by following this link.
Hilarious,.It doesn’t say when the 3 winter’s were that were warmer,Conveniently.lol,..Just more fear mongering liberal GARBAGE. Just a waste of alott of useless research,.lol