We published an earlier version of this article in August of 2021, shortly after the U.S. Census Bureau had released its diversity index. COVID coverage was dominating the news and the public interest during that period, so our original article did not get a great deal of readership.
But the subject is important enough to revisit during a slower news period.
It’s also important because the word diversity is often misused in the political arena.
According to the U.S. Census Bureau, Cobb County has the second highest Diversity Index in Georgia, with Gwinnett County at the top of the index.
The Diversity Index is measured by determining the likelihood that two people chosen at random will be of different race or ethnicity (for further details see the full definition at the bottom of this article). In other words, the most highly integrated county is the one with the highest diversity index.
The top five counties by this measure are:
- Gwinnett County 75.1 percent
- Cobb County 67.3 percent
- Liberty County 67.1 percent
- Stewart County 66.8 percent
- Fulton County 66.5 percent
The bottom five (from lowest index to highest) are:
- Fannin County 14.7 percent
- Union County 15.3 percent
- Towns County 15.5 percent
- Dade County 17.0 percent
- Pickens County 17.5 percent
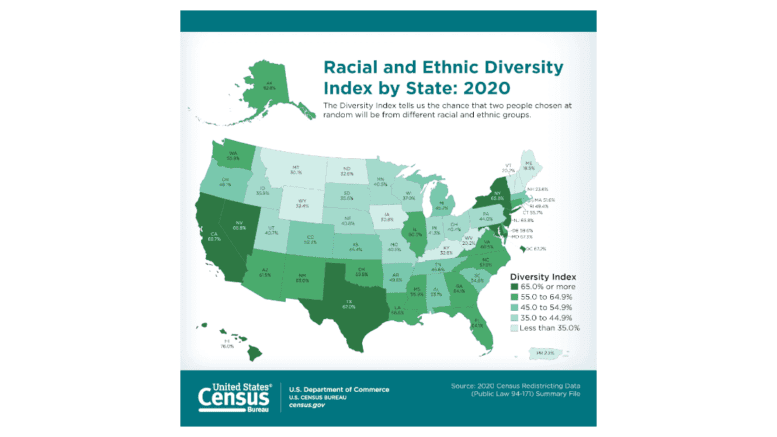
The overall Diversity Index for Georgia is 64.1 percent, tied with Florida, and second only to Texas (which stands at 67 percent) among southern states.
National Map of Diversity Index
 [Source: U.S. Census Bureau]
Census Bureau definition of Diversity Index
In a blog post on the U.S. Census Bureau website, the Diversity Index is defined as follows:
One of the measures we will use to present the 2020 Census results is the Diversity Index, or DI. This index shows the probability that two people chosen at random will be from different race and ethnic groups.
The DI is bounded between 0 and 1, with a zero-value indicating that everyone in the population has the same racial and ethnic characteristics, while a value close to 1 indicates that everyone in the population has different characteristics.
We converted the probabilities into percentages to make the results easier to interpret. In this format, the DI tells us the chance that two people chosen at random will be from different racial and ethnic groups.
September release of more detailed data
The 2020 data that the U.S. Census Bureau has released so far is the data needed by states for reapportionment. The bureau expects to release more detailed data in September, and then the public can access the data through much easier-to-use tools at https://data.census.gov.
