Do you own or manage a local business? Are you interested in learning how to do business with Cobb County or with the Cobb County School District?
The county posted the following notice to its Facebook page about an educational event that will help get you started:
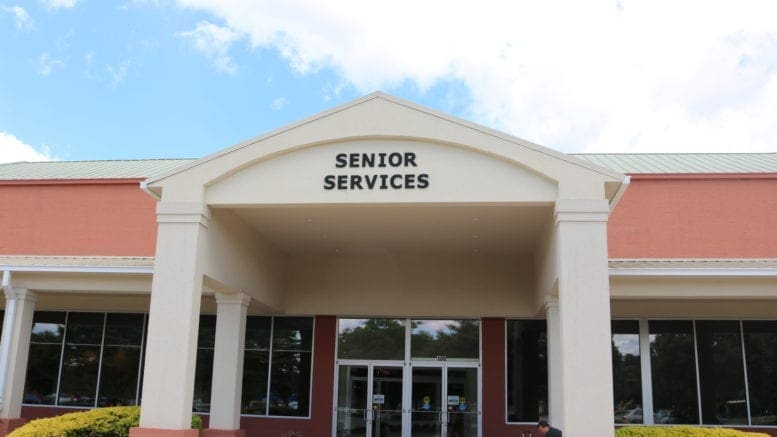
Discover how to do business with Cobb County Government and Cobb County Schools. Find out about becoming a vendor at the annual How to Do Business with Cobb seminar, 5 – 7 p.m. Wednesday, Oct. 12 at the Cobb Senior Wellness Center, 1150 Powder Springs Street, Marietta.
The seminar is an opportunity for businesses to network with department representatives, learn the process for getting started and learn more about the needs of the county and the schools,
RSVP for this event by emailing Kimberly.Jorgensen@cobbcounty.org or calling 770-528-3317.
About Cobb County
Cobb County is the third most populous county in Georgia, smaller only than Fulton and Gwinnett counties.
The governing authority is the five-member Cobb County Board of Commissioners, which includes a Chairperson and four district commissioners.
The current board is:
| Chairwoman | Lisa Cupid |
| District 1 Commissioner | Keli Gambrill |
| District 2 Commissioner | Jerica Richardson |
| District 3 Commissioner | JoAnn Birrell |
| District 4 Commissioner | Monique Sheffield |
The U.S. Census Bureau gives the following quick facts about the county:
| People Population | |
| Population Estimates, July 1 2021, (V2021) | 766,802 |
| Population estimates base, April 1, 2020, (V2021) | 766,149 |
| Population, percent change – April 1, 2020 (estimates base) to July 1, 2021, (V2021) | 0.1% |
| Population, Census, April 1, 2020 | 766149 |
| Population, Census, April 1, 2010 | 688078 |
| Age and Sex | |
| Persons under 5 years, percent | 5.6% |
| Persons under 18 years, percent | 22.7% |
| Persons 65 years and over, percent | 13.3% |
| Female persons, percent | 51.3% |
| Race and Hispanic Origin | |
| White alone, percent | 61.7% |
| Black or African American alone, percent(a) | 29.2% |
| American Indian and Alaska Native alone, percent(a) | 0.5% |
| Asian alone, percent(a) | 5.7% |
| Native Hawaiian and Other Pacific Islander alone, percent(a) | 0.1% |
| Two or More Races, percent | 2.8% |
| Hispanic or Latino, percent(b) | 13.7% |
| White alone, not Hispanic or Latino, percent | 50.2% |
| Population Characteristics | |
| Veterans, 2016-2020 | 40562 |
| Foreign born persons, percent, 2016-2020 | 15.6% |
| Housing | |
| Housing units, July 1, 2021, (V2021) | 311450 |
| Owner-occupied housing unit rate, 2016-2020 | 65.8% |
| Median value of owner-occupied housing units, 2016-2020 | $273,900 |
| Median selected monthly owner costs -with a mortgage, 2016-2020 | $1,672 |
| Median selected monthly owner costs -without a mortgage, 2016-2020 | $474 |
| Median gross rent, 2016-2020 | $1,264 |
| Building permits, 2021 | 3247 |
| Families & Living Arrangements | |
| Households, 2016-2020 | 283359 |
| Persons per household, 2016-2020 | 2.63 |
| Living in same house 1 year ago, percent of persons age 1 year+, 2016-2020 | 84.6% |
| Language other than English spoken at home, percent of persons age 5 years+, 2016-2020 | 20.5% |
| Computer and Internet Use | |
| Households with a computer, percent, 2016-2020 | 97.2% |
| Households with a broadband Internet subscription, percent, 2016-2020 | 93.3% |
| Education | |
| High school graduate or higher, percent of persons age 25 years+, 2016-2020 | 92.6% |
| Bachelor’s degree or higher, percent of persons age 25 years+, 2016-2020 | 48.4% |
| Health | |
| With a disability, under age 65 years, percent, 2016-2020 | 6.2% |
| Persons without health insurance, under age 65 years, percent | 13.8% |
| Economy | |
| In civilian labor force, total, percent of population age 16 years+, 2016-2020 | 69.6% |
| In civilian labor force, female, percent of population age 16 years+, 2016-2020 | 64.3% |
| Total accommodation and food services sales, 2017 ($1,000)(c) | 2056579 |
| Total health care and social assistance receipts/revenue, 2017 ($1,000)(c) | 5569500 |
| Total transportation and warehousing receipts/revenue, 2017 ($1,000)(c) | 1536858 |
| Total retail sales, 2017 ($1,000)(c) | 18543691 |
| Total retail sales per capita, 2017(c) | $24,615 |
| Transportation | |
| Mean travel time to work (minutes), workers age 16 years+, 2016-2020 | 31.2 |
| Income & Poverty | |
| Median household income (in 2020 dollars), 2016-2020 | $80,830 |
| Per capita income in past 12 months (in 2020 dollars), 2016-2020 | $41,480 |
| Persons in poverty, percent | 9.2% |
| Businesses Businesses | |
| Total employer establishments, 2020 | 21492 |
| Total employment, 2020 | 358927 |
| Total annual payroll, 2020 ($1,000) | 21780372 |
| Total employment, percent change, 2019-2020 | -0.3% |
| Total nonemployer establishments, 2019 | 86497 |
| All employer firms, Reference year 2017 | 17066 |
| Men-owned employer firms, Reference year 2017 | 10386 |
| Women-owned employer firms, Reference year 2017 | 3537 |
| Minority-owned employer firms, Reference year 2017 | 3058 |
| Nonminority-owned employer firms, Reference year 2017 | 12177 |
| Veteran-owned employer firms, Reference year 2017 | 1204 |
| Nonveteran-owned employer firms, Reference year 2017 | 13909 |
| Geography Geography | |
| Population per square mile, 2020 | 2254.8 |
| Population per square mile, 2010 | 2026.4 |
| Land area in square miles, 2020 | 339.78 |
| Land area in square miles, 2010 | 339.55 |