The City of Marietta posted the following announcement to its website about a public hearing on the FY2024 budget, which will be voted on by the city council on Jun 14, 2023 and if passed will take effect July 1.
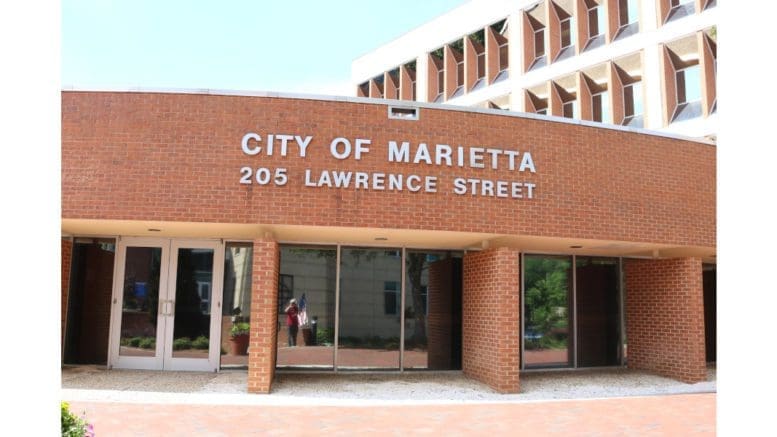
The City of Marietta will hold a public hearing on the Recommended Fiscal Year 2024 Budget which begins July 1, 2023, on Tuesday, June 6, 2023, at 6:00 pm in the Council Chamber located at 205 Lawrence Street, Marietta, GA.
The general fund budget accounts for government services including police and fire services, parks and recreation programs, code enforcement, planning and development, and streets and public works maintenance.
The City’s millage rate that supports governmental services is currently 2.788 mills and is expected to remain the same.
The City’s overall FY2024 budget is $395.9 million, which includes $73.7 million for the general fund.
Citizens are invited to attend the public hearing. City staff will present a brief overview of the budget, and citizens may comment and ask questions at that time. The Marietta City Council will consider the budget for approval at its regular scheduled meeting on June 14, 2023 at 7:00 pm in the Council Chamber.
About the City of Marietta
The City of Marietta is the county seat of Cobb County. The latest estimate from the U.S. Census Bureau puts the population of the city at 60,867 which makes it the second largest city in Cobb County by population, smaller only than the newly incorporated City of Mableton.
Here are a few quick facts from the Census Bureau
| Marietta city, Georgia | |
| Population, Census, April 1, 2020 | 60972 |
| Population, Census, April 1, 2010 | 56579 |
| Age and Sex | |
| Persons under 5 years, percent | 6.7% |
| Persons under 18 years, percent | 21.8% |
| Persons 65 years and over, percent | 13.2% |
| Female persons, percent | 49.9% |
| Race and Hispanic Origin | |
| White alone, percent | 53.4% |
| Black or African American alone, percent(a) | 32.3% |
| American Indian and Alaska Native alone, percent(a) | 0.6% |
| Asian alone, percent(a) | 1.9% |
| Native Hawaiian and Other Pacific Islander alone, percent(a) | 0.0% |
| Two or More Races, percent | 4.7% |
| Hispanic or Latino, percent(b) | 15.7% |
| White alone, not Hispanic or Latino, percent | 46.4% |
| Population Characteristics | |
| Veterans, 2016-2020 | 2678 |
| Foreign born persons, percent, 2016-2020 | 16.6% |
| Housing | |
| Owner-occupied housing unit rate, 2016-2020 | 44.0% |
| Median value of owner-occupied housing units, 2016-2020 | $310,100 |
| Median selected monthly owner costs -with a mortgage, 2016-2020 | $1,856 |
| Median selected monthly owner costs -without a mortgage, 2016-2020 | $526 |
| Median gross rent, 2016-2020 | $1,145 |
| Families & Living Arrangements | |
| Households, 2016-2020 | 24148 |
| Persons per household, 2016-2020 | 2.39 |
| Living in same house 1 year ago, percent of persons age 1 year+, 2016-2020 | 77.9% |
| Language other than English spoken at home, percent of persons age 5 years+, 2016-2020 | 23.7% |
| Computer and Internet Use | |
| Households with a computer, percent, 2016-2020 | 95.1% |
| Households with a broadband Internet subscription, percent, 2016-2020 | 86.6% |
| Education | |
| High school graduate or higher, percent of persons age 25 years+, 2016-2020 | 88.6% |
| Bachelor’s degree or higher, percent of persons age 25 years+, 2016-2020 | 44.0% |
| Health | |
| With a disability, under age 65 years, percent, 2016-2020 | 6.3% |
| Persons without health insurance, under age 65 years, percent | 20.2% |
| Economy | |
| In civilian labor force, total, percent of population age 16 years+, 2016-2020 | 67.2% |
| In civilian labor force, female, percent of population age 16 years+, 2016-2020 | 61.2% |
| Total accommodation and food services sales, 2012 ($1,000)(c) | 264544 |
| Total health care and social assistance receipts/revenue, 2012 ($1,000)(c) | 1584232 |
| Total manufacturers shipments, 2012 ($1,000)(c) | 1129407 |
| Total retail sales, 2012 ($1,000)(c) | 1976915 |
| Total retail sales per capita, 2012(c) | $33,875 |
| Transportation | |
| Mean travel time to work (minutes), workers age 16 years+, 2016-2020 | 28.5 |
| Income & Poverty | |
| Median household income (in 2020 dollars), 2016-2020 | $59,594 |
| Per capita income in past 12 months (in 2020 dollars), 2016-2020 | $36,112 |
| Persons in poverty, percent | 14.1% |
| Businesses | |
| All firms, 2012 | 10501 |
| Men-owned firms, 2012 | 4934 |
| Women-owned firms, 2012 | 4186 |
| Minority-owned firms, 2012 | 4286 |
| Nonminority-owned firms, 2012 | 5502 |
| Veteran-owned firms, 2012 | 1015 |
| Nonveteran-owned firms, 2012 | 8663 |
| Geography | |
| Population per square mile, 2010 | 2451.4 |
| Land area in square miles, 2010 | 23.08 |
About the City of Marietta
The City of Marietta is the county seat of Cobb County. The latest estimate from the U.S. Census Bureau puts the population of the city at 60,867 which makes it the second largest city in Cobb County by population, smaller only than the newly incorporated City of Mableton.
Here are a few quick facts from the Census Bureau
Marietta city, Georgia
Population, Census, April 1, 2020
60972
Population, Census, April 1, 2010
56579
Age and Sex
Persons under 5 years, percent
6.7%
Persons under 18 years, percent
21.8%
Persons 65 years and over, percent
13.2%
Female persons, percent
49.9%
Race and Hispanic Origin
White alone, percent
53.4%
Black or African American alone, percent(a)
32.3%
American Indian and Alaska Native alone, percent(a)
0.6%
Asian alone, percent(a)
1.9%
Native Hawaiian and Other Pacific Islander alone, percent(a)
0.0%
Two or More Races, percent
4.7%
Hispanic or Latino, percent(b)
15.7%
White alone, not Hispanic or Latino, percent
46.4%
Population Characteristics
Veterans, 2016-2020
2678
Foreign born persons, percent, 2016-2020
16.6%
Housing
Owner-occupied housing unit rate, 2016-2020
44.0%
Median value of owner-occupied housing units, 2016-2020
$310,100
Median selected monthly owner costs -with a mortgage, 2016-2020
$1,856
Median selected monthly owner costs -without a mortgage, 2016-2020
$526
Median gross rent, 2016-2020
$1,145
Families & Living Arrangements
Households, 2016-2020
24148
Persons per household, 2016-2020
2.39
Living in same house 1 year ago, percent of persons age 1 year+, 2016-2020
77.9%
Language other than English spoken at home, percent of persons age 5 years+, 2016-2020
23.7%
Computer and Internet Use
Households with a computer, percent, 2016-2020
95.1%
Households with a broadband Internet subscription, percent, 2016-2020
86.6%
Education
High school graduate or higher, percent of persons age 25 years+, 2016-2020
88.6%
Bachelor’s degree or higher, percent of persons age 25 years+, 2016-2020
44.0%
Health
With a disability, under age 65 years, percent, 2016-2020
6.3%
Persons without health insurance, under age 65 years, percent
20.2%
Economy
In civilian labor force, total, percent of population age 16 years+, 2016-2020
67.2%
In civilian labor force, female, percent of population age 16 years+, 2016-2020
61.2%
Total accommodation and food services sales, 2012 ($1,000)(c)
264544
Total health care and social assistance receipts/revenue, 2012 ($1,000)(c)
1584232
Total manufacturers shipments, 2012 ($1,000)(c)
1129407
Total retail sales, 2012 ($1,000)(c)
1976915
Total retail sales per capita, 2012(c)
$33,875
Transportation
Mean travel time to work (minutes), workers age 16 years+, 2016-2020
28.5
Income & Poverty
Median household income (in 2020 dollars), 2016-2020
$59,594
Per capita income in past 12 months (in 2020 dollars), 2016-2020
$36,112
Persons in poverty, percent
14.1%
Businesses
All firms, 2012
10501
Men-owned firms, 2012
4934
Women-owned firms, 2012
4186
Minority-owned firms, 2012
4286
Nonminority-owned firms, 2012
5502
Veteran-owned firms, 2012
1015
Nonveteran-owned firms, 2012
8663
Geography
Population per square mile, 2010
2451.4
Land area in square miles, 2010
23.08