Next month is National Poverty Awareness Month for 2024, so we’re going to get right to the point of the headline: the percentage of people living in poverty in Cobb County at the best current estimate is 8.3 percent, according to the 5-year American Community Survey released yesterday by the U.S. Census Bureau (more on that below).
Breaking that down further, the percentage of people living below the federal poverty rate was 6.2 percent among White residents, 9.7 percent of Black residents and 15.6 percent among Hispanic or Latino residents of any race. See the table below for the poverty rate of Cobb residents of other race and ethnicities.
The percentage of children in poverty in Cobb County is about 10.4 percent. So a little more than one in ten of the children in our county are in families below the poverty line, and are susceptible to all the attendant issues that come with poverty, from poor nutrition to barriers to educational achievement.
So how does Cobb County compare to the nation as a whole, Georgia’s rate, and neighboring counties?
Nationally the percentage of people living below the poverty line is 12.5 percent (so at 8.3 percent Cobb’s rate is lower). Georgia’s rate is 13.5 percent, a point higher than the national average, so Cobb compares even more favorably compared to Georgia’s overall rate.
Of adjacent counties, the rate in Fulton is 12.5 percent, Douglas is 11.6 percent, Paulding 6.7 percent, and Cherokee 6.6 percent.
What is the trend in Cobb County?
The current 5-year ACS ran from 2018 to 2022. Compared to the 5-year ACS ending in 2017 the poverty rate in the county has dropped, from 10.9 percent in 2017 to 8.3 percent for 2022.
According to a recent press release from the Census Bureau, the national rate declined significantly from the last non-overlapping ACS (2013-2017) and about a third of U.S. counties experienced declining poverty rate.
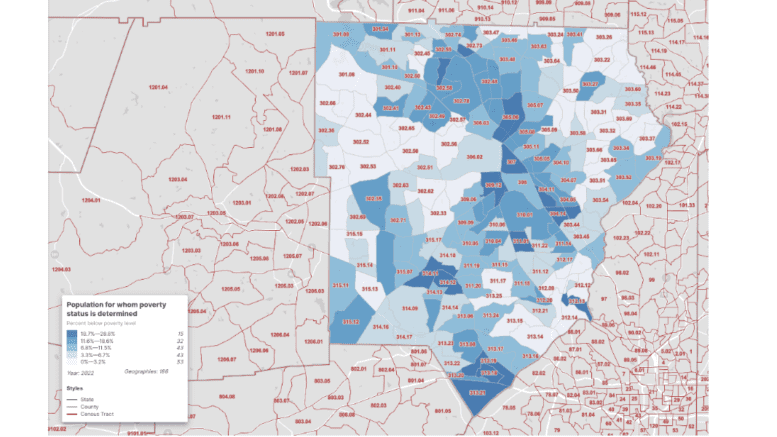
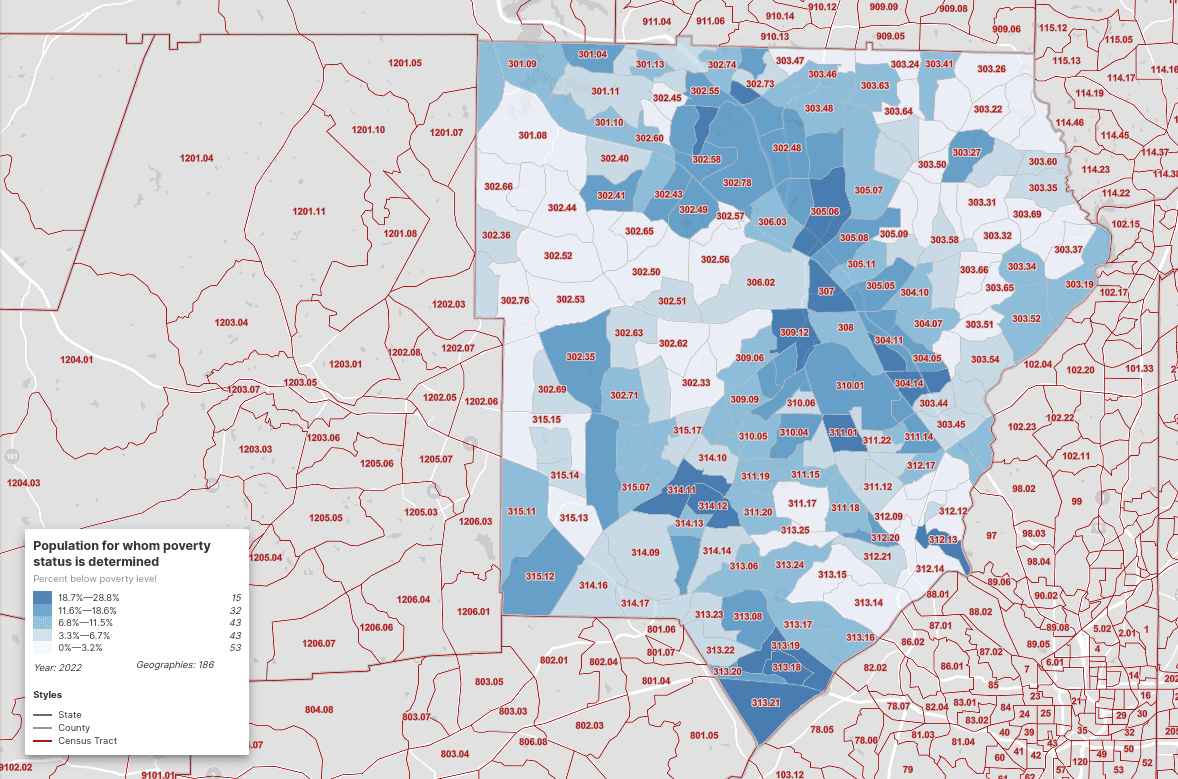
How is poverty distributed across Cobb County?
We’re going to dig much further into the distribution of poverty in the county by census tract in a later article, but below is a screenshot of a map generated at https://data.census.gov. You can visit an interactive version at this link.
Note that every part of the county has census tracts with poverty rates above 10 percent, even East Cobb.
Poverty by different demographic groups in the county
Below is the table for Cobb County’s poverty figures in the 2018-2022 ACS (the table number designated by the census is S1701). We removed the margins of error columns so the table would fit on a web page, but we saved the complete table as an Excel spreadsheet that you can download by following this link.
| Label (Grouping) | Cobb’s total population breakdown | Total count of each group below poverty | Percentage of each group below poverty |
| Population for whom poverty status is determined | 754716 | 62536 | 8.3% |
| AGE | |||
| Under 18 years | 172984 | 18033 | 10.4% |
| Under 5 years | 43454 | 4509 | 10.4% |
| 5 to 17 years | 129530 | 13524 | 10.4% |
| Related children of householder under 18 years | 172331 | 17388 | 10.1% |
| 18 to 64 years | 483841 | 37766 | 7.8% |
| 18 to 34 years | 175551 | 19710 | 11.2% |
| 35 to 64 years | 308290 | 18056 | 5.9% |
| 60 years and over | 141584 | 9742 | 6.9% |
| 65 years and over | 97891 | 6737 | 6.9% |
| SEX | |||
| Male | 367574 | 28229 | 7.7% |
| Female | 387142 | 34307 | 8.9% |
| RACE AND HISPANIC OR LATINO ORIGIN | |||
| White alone | 399116 | 24557 | 6.2% |
| Black or African American alone | 206541 | 19997 | 9.7% |
| American Indian and Alaska Native alone | 2901 | 885 | 30.5% |
| Asian alone | 42407 | 1702 | 4.0% |
| Native Hawaiian and Other Pacific Islander alone | 342 | 26 | 7.6% |
| Some other race alone | 46195 | 9468 | 20.5% |
| Two or more races | 57214 | 5901 | 10.3% |
| Hispanic or Latino origin (of any race) | 101661 | 15836 | 15.6% |
| White alone, not Hispanic or Latino | 372825 | 21414 | 5.7% |
| EDUCATIONAL ATTAINMENT | |||
| Population 25 years and over | 516257 | 32925 | 6.4% |
| Less than high school graduate | 35492 | 6191 | 17.4% |
| High school graduate (includes equivalency) | 90693 | 8776 | 9.7% |
| Some college, associate’s degree | 132089 | 8991 | 6.8% |
| Bachelor’s degree or higher | 257983 | 8967 | 3.5% |
| EMPLOYMENT STATUS | |||
| Civilian labor force 16 years and over | 427975 | 23146 | 5.4% |
| Employed | 408304 | 19292 | 4.7% |
| Male | 214001 | 9046 | 4.2% |
| Female | 194303 | 10246 | 5.3% |
| Unemployed | 19671 | 3854 | 19.6% |
| Male | 8877 | 1671 | 18.8% |
| Female | 10794 | 2183 | 20.2% |
| WORK EXPERIENCE | |||
| Population 16 years and over | 603386 | 46574 | 7.7% |
| Worked full-time, year-round in the past 12 months | 306862 | 5401 | 1.8% |
| Worked part-time or part-year in the past 12 months | 135050 | 18010 | 13.3% |
| Did not work | 161474 | 23163 | 14.3% |
| ALL INDIVIDUALS WITH INCOME BELOW THE FOLLOWING POVERTY RATIOS | |||
| 50 percent of poverty level | 28489 | (X) | (X) |
| 125 percent of poverty level | 84961 | (X) | (X) |
| 150 percent of poverty level | 107587 | (X) | (X) |
| 185 percent of poverty level | 145653 | (X) | (X) |
| 200 percent of poverty level | 160095 | (X) | (X) |
| 300 percent of poverty level | 269058 | (X) | (X) |
| 400 percent of poverty level | 364544 | (X) | (X) |
| 500 percent of poverty level | 451073 | (X) | (X) |
| UNRELATED INDIVIDUALS FOR WHOM POVERTY STATUS IS DETERMINED | 141657 | 25448 | 18.0% |
| Male | 69625 | 11184 | 16.1% |
| Female | 72032 | 14264 | 19.8% |
| 15 years | 161 | 161 | 100.0% |
| 16 to 17 years | 492 | 484 | 98.4% |
| 18 to 24 years | 18623 | 7881 | 42.3% |
| 25 to 34 years | 36856 | 4415 | 12.0% |
| 35 to 44 years | 19684 | 2240 | 11.4% |
| 45 to 54 years | 20205 | 3000 | 14.8% |
| 55 to 64 years | 19441 | 3356 | 17.3% |
| 65 to 74 years | 14543 | 1900 | 13.1% |
| 75 years and over | 11652 | 2011 | 17.3% |
| Mean income deficit for unrelated individuals (dollars) | 7949 | (X) | (X) |
| Worked full-time, year-round in the past 12 months | 77597 | 1810 | 2.3% |
| Worked less than full-time, year-round in the past 12 months | 31816 | 10989 | 34.5% |
| Did not work | 32244 | 12649 | 39.2% |
| Population in housing units for whom poverty status is determined | 754172 | 62164 | 8.2% |
About the American Community Survey
Yesterday was a big day for people who follow the census. The 5-year American Community Survey (ACS) for 2018 to 2022 was released.
The one sentence version of the difference between the Decennial Census and the ACS is: the better-known decennial census attempts to count the entire nation every ten years, but asks a lot fewer questions. The ACS polls a lot fewer people but with a lot more questions and is done yearly and then grouped into 1-year- and 5-year versions.
Both the Decennial Census and the ACS are important.
The Decennial Census determines how many representatives each state gets in the House of Representatives.
The ACS has an enormous amount of data not on the 2020 Decennial Census, such as education, employment, internet access, and transportation, and is used by federal, state and local governments, businesses and policy advocates to make decisions about where to place their efforts.