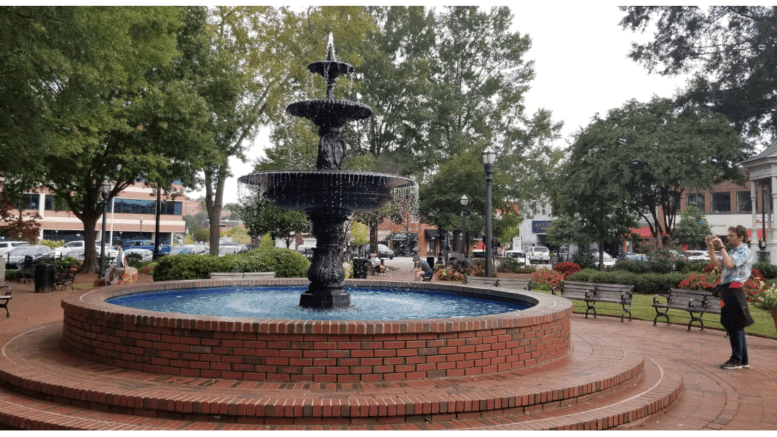
Two popular annual festivals will be held in Marietta Square on consecutive weekends at the end of April and beginning of May.
Taste of Marietta
The Taste of Marietta will be held in two weeks, on Sunday, April 28. The event offers food, events for the kids, beer and wine for the adults, and music for everyone.
The following details are reprinted from the City of Marietta website:
Taste the flavors of Cobb County at the 29th annual Taste of Marietta, one of the largest and tastiest food festivals in Georgia, on Sunday, April 28th.
Join 50+ food vendors on the Marietta Square from 11 a.m. to 7 p.m. Free admission into the event allows visitors to purchase as many “tastes” as they desire, each for $2 to $9.
Festival-goers can anticipate a variety of restaurants and food trucks. The Chef’s Stage returns with celebrity chefs’ demonstrations, where culinary experts share their tips, tricks, and insider knowledge. Beer and wine will also be available for purchase throughout the festival.
In addition to food, the festival will feature live music, a kids alley, local theater performances and more. Musical entertainment can be heard throughout the festival
from the Cobb Life Stage and the Main Band Stand in Glover Park.
The Marietta Visitors Bureau hosts this delicious event in conjunction with the City of Marietta. For additional information, visit tasteofmarietta.com or call 770-429-1115.
The mission of the Marietta Visitors Bureau is to promote the City of Marietta as a tourism destination in an effort to increase visitation and economic activity.
For more information, please visit the website.
May-Retta Daze
A week after the Taste of Mableton the city will host its annual May-Retta Daze festival, also on Marietta Square.
The description below, reprinted from the City of Marietta website, gives an overview of the attractions at this two-day festival:
May-Retta Daze is a two-day art, crafts & music outdoor festival, presented by Superior Plumbing, held annually, the first weekend in May at the Historic Marietta Square. The festival features exhibitors and artists showcasing handmade goods including painting, pottery, woodwork, metal, glass, fabric, soap, candles and more. In addition to a wide variety of arts & crafts, the Music Festival will showcase various live acoustic musical performances from local artists throughout both days. There is something for everyone with festival food, kid’s zone and live music. Bring the entire family to shop, relax and soak up the sounds on the Marietta Square.
Saturday, May 4 and Sunday, May 5
Saturday 10:00 a.m. – 7:00 p.m. | Sunday 11:00 a.m. – 5:00 p.m.
Glover Park at Historic Marietta Square, 50 N Park Square NE Marietta, GA 30060
Arts, Crafts, and Music Festival Schedule
Saturday
10:00 a.m. – 6:00 p.m. Arts & Crafts Show, Kid’s Zone, Festival Food
10:00 a.m. – 7:00 p.m. Music Festival performances by local musicians on the Glover Park stage
Sunday
11:00 a.m. – 5:00 p.m. Arts & Crafts Show, Kid’s Zone, Festival Food
11:00 a.m. – 5:00 p.m. Music Festival performances by local musicians on the Glover Park stage
About the City of Marietta
The City of Marietta is the county seat of Cobb County. The latest estimate from the U.S. Census Bureau puts the population of the city at 60,867 which makes it the second largest city in Cobb County by population, smaller only than the newly incorporated City of Mableton.
Here are a few quick facts from the Census Bureau
| Marietta city, Georgia | |
| Population, Census, April 1, 2020 | 60972 |
| Population, Census, April 1, 2010 | 56579 |
| Age and Sex | |
| Persons under 5 years, percent | 6.7% |
| Persons under 18 years, percent | 21.8% |
| Persons 65 years and over, percent | 13.2% |
| Female persons, percent | 49.9% |
| Race and Hispanic Origin | |
| White alone, percent | 53.4% |
| Black or African American alone, percent(a) | 32.3% |
| American Indian and Alaska Native alone, percent(a) | 0.6% |
| Asian alone, percent(a) | 1.9% |
| Native Hawaiian and Other Pacific Islander alone, percent(a) | 0.0% |
| Two or More Races, percent | 4.7% |
| Hispanic or Latino, percent(b) | 15.7% |
| White alone, not Hispanic or Latino, percent | 46.4% |
| Population Characteristics | |
| Veterans, 2016-2020 | 2678 |
| Foreign born persons, percent, 2016-2020 | 16.6% |
| Housing | |
| Owner-occupied housing unit rate, 2016-2020 | 44.0% |
| Median value of owner-occupied housing units, 2016-2020 | $310,100 |
| Median selected monthly owner costs -with a mortgage, 2016-2020 | $1,856 |
| Median selected monthly owner costs -without a mortgage, 2016-2020 | $526 |
| Median gross rent, 2016-2020 | $1,145 |
| Families & Living Arrangements | |
| Households, 2016-2020 | 24148 |
| Persons per household, 2016-2020 | 2.39 |
| Living in same house 1 year ago, percent of persons age 1 year+, 2016-2020 | 77.9% |
| Language other than English spoken at home, percent of persons age 5 years+, 2016-2020 | 23.7% |
| Computer and Internet Use | |
| Households with a computer, percent, 2016-2020 | 95.1% |
| Households with a broadband Internet subscription, percent, 2016-2020 | 86.6% |
| Education | |
| High school graduate or higher, percent of persons age 25 years+, 2016-2020 | 88.6% |
| Bachelor’s degree or higher, percent of persons age 25 years+, 2016-2020 | 44.0% |
| Health | |
| With a disability, under age 65 years, percent, 2016-2020 | 6.3% |
| Persons without health insurance, under age 65 years, percent | 20.2% |
| Economy | |
| In civilian labor force, total, percent of population age 16 years+, 2016-2020 | 67.2% |
| In civilian labor force, female, percent of population age 16 years+, 2016-2020 | 61.2% |
| Total accommodation and food services sales, 2012 ($1,000)(c) | 264544 |
| Total health care and social assistance receipts/revenue, 2012 ($1,000)(c) | 1584232 |
| Total manufacturers shipments, 2012 ($1,000)(c) | 1129407 |
| Total retail sales, 2012 ($1,000)(c) | 1976915 |
| Total retail sales per capita, 2012(c) | $33,875 |
| Transportation | |
| Mean travel time to work (minutes), workers age 16 years+, 2016-2020 | 28.5 |
| Income & Poverty | |
| Median household income (in 2020 dollars), 2016-2020 | $59,594 |
| Per capita income in past 12 months (in 2020 dollars), 2016-2020 | $36,112 |
| Persons in poverty, percent | 14.1% |
| Businesses | |
| All firms, 2012 | 10501 |
| Men-owned firms, 2012 | 4934 |
| Women-owned firms, 2012 | 4186 |
| Minority-owned firms, 2012 | 4286 |
| Nonminority-owned firms, 2012 | 5502 |
| Veteran-owned firms, 2012 | 1015 |
| Nonveteran-owned firms, 2012 | 8663 |
| Geography | |
| Population per square mile, 2010 | 2451.4 |
| Land area in square miles, 2010 | 23.08 |