The City of Powder Springs distributed the following announcement about its fourth annual seafood festival, returning May 17-19.
Seafood festival again sails into Powder Springs May 17-19

City of Powder Springs and Robin Roberts Promotions present the fourth-annual Bringing The Sea To the Springs Seafood Festival
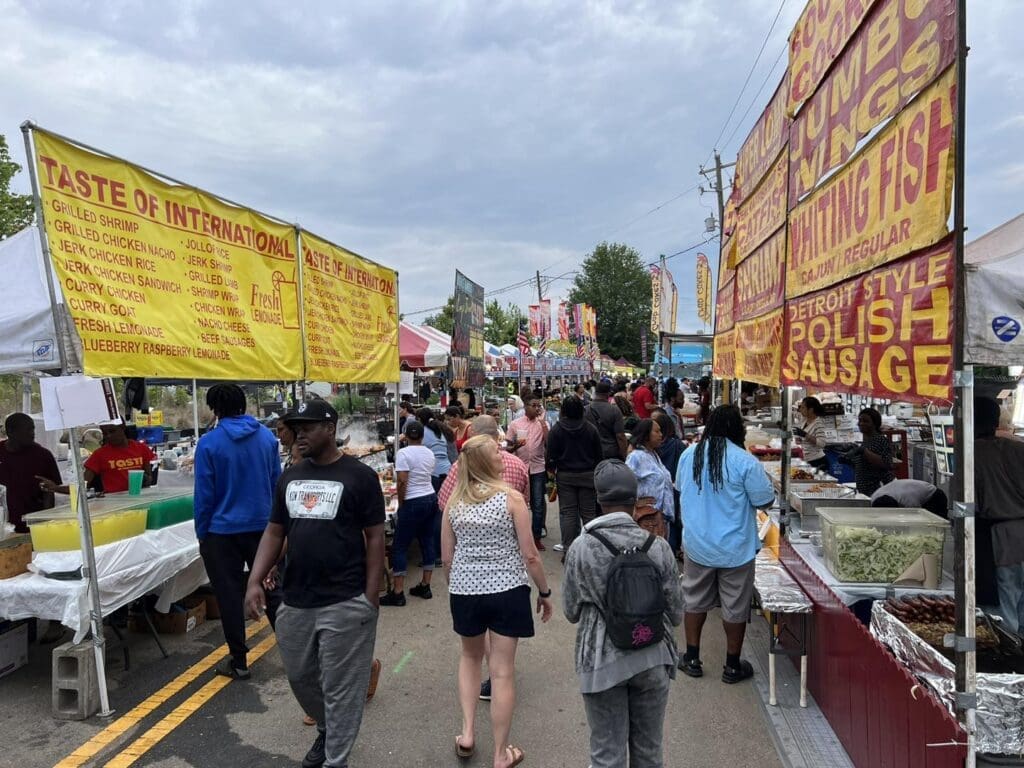
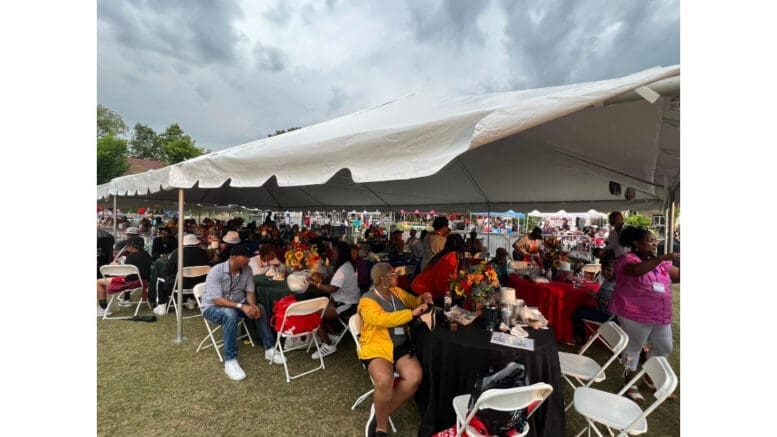
Why leave dry land when downtown Powder Springs will be THE destination May 17-19 for fresh seafood along with live music and arts & crafts for sale from talented artisans? All this and more will be offered at the fourth-annual “Bringing the Sea to the Springs” festival.
The City of Powder Springs has once again joined with Robin Roberts Promotions to present this FREE family event designed to bring the community together through tasty food, juried arts and crafts, fellowship, and fun.
The inaugural festival in 2021 welcomed over 10,000 attendees, and its successful return in 2022 earned the “Spot On Event of the Year” Award from Cobb Travel & Tourism.
Vendors and festivities will be centered around Thurman Springs Park at 4485 Pineview Drive in the heart of Powder Springs’ downtown. Parking, in addition to attendance, is also free, with the festival running from 1 to 9 p.m. Friday, 10 a.m. to 9 p.m. Saturday, and noon to 4 p.m. Sunday.
While the emphasis is enjoying fresh seafood, other cuisines will be available as well. The list of Seafood and Landlubbers Food Vendors will offer a variety of cuisine to satisfy diverse palates, from vendors such as BJ’s Concessions, California Fish Market, Conch Sabroso, Egg Roll Boyz, Fish Fusion, Flavors by J. Mitchell, Gripps Catering and Grill, Henry’s Kitchen, Laughing Crab, LH Enterprises, Mouthful Atlanta, Off the Hook, Pinch & Pull, Snow Angel Delights, Southern Fried Catfish, Tropical Frozen Paradise, and Vieux Carre Bistro.
The festival features arts and crafts for sale, plus live music throughout the weekend from local Atlanta musicians including Gold Standard Band, a cover band that plays hits from R&B groups; Crossroads Band, an acoustic and electric band specializing in bluesy and easy-goin’ tunes; and Saturday’s headliner Dwayne Dopsie & The Zydeco Hellraisers. A Louisiana native who writes both the lyrics and music for his songs, Dwayne (Dopsie) Rubin is a singer/songwriter and accordionist that has performed all over the world since debuting his band at the age of 19.
Hailing from one of the most influential Zydeco families in the world and inspired by tradition, Rubin has developed his own high-energy style that defies existing stereotypes and blazes a refreshingly distinct path for 21st century Zydeco music.
Additional acts are listed on the event website, bringingtheseatothesprings.com.
No coolers or pets are allowed. General admission and parking to the festival are free, however, there are tickets available for unique events taking place such as The Beach Club VIP Ticket at $10, which includes VIP seating.
Sponsors for Bringing the Sea to the Springs 2024 are The City of Powder Springs, Cobb Travel and Tourism, Georgia Party and Tool Rental, Spa Wags, Rid Property Services, Croy Engineering, and Collett’s Country Store – Johnny’s BBQ.
About the City of Powder Springs
The City of Powder Springs was incorporated in September of 1883.
The City Councils is as follows:
| Mayor | Al Thurman |
| Councilman Ward 1 and Mayor Pro Tem | Henry Lust |
| Councilwoman Ward 2 | Doris Dawkins |
| Councilman Ward 3 | Dwayne Green |
| Councilman Post 1 At Large | Dwight McMutry |
| Councilwoman Post 2 At Large | Patricia Wisdom |
The U.S. Census Bureau gives the following quick facts about the City of Powder Springs:
| Population | |
| Population Estimates, July 1 2021, (V2021) | 17,083 |
| Population estimates base, April 1, 2020, (V2021) | 16,901 |
| Population, percent change – April 1, 2020 (estimates base) to July 1, 2021, (V2021) | 1.1% |
| Population, Census, April 1, 2020 | 16,887 |
| Population, Census, April 1, 2010 | 13,940 |
| Age and Sex | |
| Persons under 5 years, percent | 6.6% |
| Persons under 18 years, percent | 24.3% |
| Persons 65 years and over, percent | 14.6% |
| Female persons, percent | 56.8% |
| Race and Hispanic Origin | |
| White alone, percent | 34.2% |
| Black or African American alone, percent(a) | 56.0% |
| American Indian and Alaska Native alone, percent(a) | 1.3% |
| Asian alone, percent(a) | 1.5% |
| Native Hawaiian and Other Pacific Islander alone, percent(a) | 0.0% |
| Two or More Races, percent | 2.9% |
| Hispanic or Latino, percent(b) | 14.7% |
| White alone, not Hispanic or Latino, percent | 29.5% |
| Population Characteristics | |
| Veterans, 2016-2020 | 1,356 |
| Foreign born persons, percent, 2016-2020 | 9.6% |
| Housing | |
| Housing units, July 1, 2021, (V2021) | X |
| Owner-occupied housing unit rate, 2016-2020 | 80.1% |
| Median value of owner-occupied housing units, 2016-2020 | $181,000 |
| Median selected monthly owner costs -with a mortgage, 2016-2020 | $1,328 |
| Median selected monthly owner costs -without a mortgage, 2016-2020 | $453 |
| Median gross rent, 2016-2020 | $1,296 |
| Building permits, 2021 | X |
| Families & Living Arrangements | |
| Households, 2016-2020 | 5,570 |
| Persons per household, 2016-2020 | 2.72 |
| Living in same house 1 year ago, percent of persons age 1 year+, 2016-2020 | 89.1% |
| Language other than English spoken at home, percent of persons age 5 years+, 2016-2020 | 15.2% |
| Computer and Internet Use | |
| Households with a computer, percent, 2016-2020 | 94.6% |
| Households with a broadband Internet subscription, percent, 2016-2020 | 91.1% |
| Education | |
| High school graduate or higher, percent of persons age 25 years+, 2016-2020 | 94.1% |
| Bachelor’s degree or higher, percent of persons age 25 years+, 2016-2020 | 39.4% |
| Health | |
| With a disability, under age 65 years, percent, 2016-2020 | 8.6% |
| Persons without health insurance, under age 65 years, percent | 9.4% |
| Economy | |
| In civilian labor force, total, percent of population age 16 years+, 2016-2020 | 67.6% |
| In civilian labor force, female, percent of population age 16 years+, 2016-2020 | 63.5% |
| Total accommodation and food services sales, 2017 ($1,000)(c) | 29,526 |
| Total health care and social assistance receipts/revenue, 2017 ($1,000)(c) | 39,184 |
| Total transportation and warehousing receipts/revenue, 2017 ($1,000)(c) | 7,540 |
| Total retail sales, 2017 ($1,000)(c) | 181,543 |
| Total retail sales per capita, 2017(c) | $12,102 |
| Transportation | |
| Mean travel time to work (minutes), workers age 16 years+, 2016-2020 | 37.6 |
| Income & Poverty | |
| Median household income (in 2020 dollars), 2016-2020 | $72,810 |
| Per capita income in past 12 months (in 2020 dollars), 2016-2020 | $32,601 |
| Persons in poverty, percent | 6.3% |
| Businesses | |
| Total employer establishments, 2020 | X |
| Total employment, 2020 | X |
| Total annual payroll, 2020 ($1,000) | X |
| Total employment, percent change, 2019-2020 | X |
| Total nonemployer establishments, 2019 | X |
| All employer firms, Reference year 2017 | 300 |
| Men-owned employer firms, Reference year 2017 | 134 |
| Women-owned employer firms, Reference year 2017 | S |
| Minority-owned employer firms, Reference year 2017 | S |
| Nonminority-owned employer firms, Reference year 2017 | 170 |
| Veteran-owned employer firms, Reference year 2017 | S |
| Nonveteran-owned employer firms, Reference year 2017 | 247 |
| Geography | |
| Population per square mile, 2020 | 2,288.5 |
| Population per square mile, 2010 | 1,944.7 |
| Land area in square miles, 2020 | 7.38 |
| Land area in square miles, 2010 | 7.17 |
