The agenda for this evening’s meeting of the Smyrna City Council includes formalizing Juneteenth and Veterans Day as paid city holidays, and the appointment of Deputy City Administrator Penny Moceri to chair the License and Variance Board. Moceri will replace Fire Chief Roy Acree, the current board chairman, who is retiring.
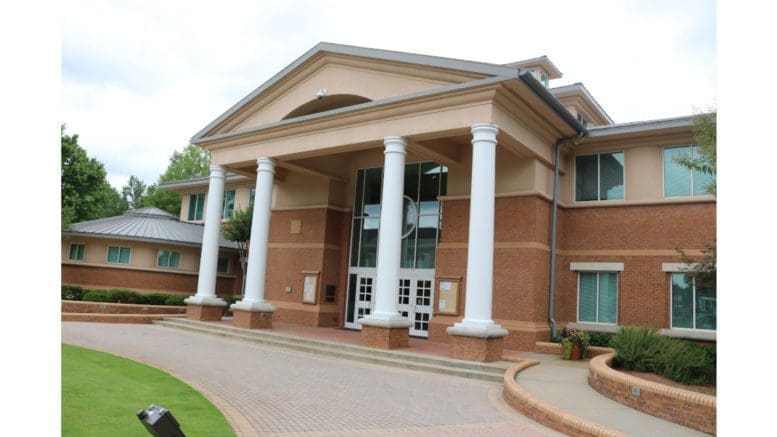
The meeting will begin at 7 p.m. at the Smyrna City Hall (A. Max Bacon City Hall) 2800 King Street Smyrna, Georgia 30080.
You can view the full agenda by following this link.
About the City of Smyrna
Smyrna is the second-largest city in Cobb County, after Marietta, the county seat.
Smyrna was incorporated by an act of the Georgia legislature in 1872. To see a copy of the original incorporation legislation, follow this link.
The U.S. Census Bureau gives the latest quick facts about Smyrna:
| Smyrna city, Georgia | |
| Population Estimates, July 1 2021, (V2021) | 55,685 |
| People Population | |
| Population Estimates, July 1 2021, (V2021) | 55,685 |
| Population estimates base, April 1, 2020, (V2021) | 55,689 |
| Population, percent change – April 1, 2020 (estimates base) to July 1, 2021, (V2021) | 0.0% |
| Population, Census, April 1, 2020 | 55663 |
| Population, Census, April 1, 2010 | 51271 |
| Age and Sex | |
| Persons under 5 years, percent | 7.8% |
| Persons under 18 years, percent | 23.2% |
| Persons 65 years and over, percent | 9.3% |
| Female persons, percent | 53.0% |
| Race and Hispanic Origin | |
| White alone, percent | 46.8% |
| Black or African American alone, percent(a) | 33.2% |
| American Indian and Alaska Native alone, percent(a) | 0.3% |
| Asian alone, percent(a) | 8.2% |
| Native Hawaiian and Other Pacific Islander alone, percent(a) | 0.3%The agenda for this evening’s meeting of the Smyrna City Council includes formalizing Juneteenth and Veterans Day as paid city holidays |
| Two or More Races, percent | 4.5% |
| Hispanic or Latino, percent(b) | 13.6% |
| White alone, not Hispanic or Latino, percent | 42.9% |
| Population Characteristics | |
| Veterans, 2016-2020 | 2352 |
| Foreign born persons, percent, 2016-2020 | 16.5% |
| Housing | |
| Housing units, July 1, 2021, (V2021) | X |
| Owner-occupied housing unit rate, 2016-2020 | 55.5% |
| Median value of owner-occupied housing units, 2016-2020 | $309,000 |
| Median selected monthly owner costs -with a mortgage, 2016-2020 | $1,871 |
| Median selected monthly owner costs -without a mortgage, 2016-2020 | $471 |
| Median gross rent, 2016-2020 | $1,326 |
| Building permits, 2021 | X |
| Families & Living Arrangements | |
| Households, 2016-2020 | 24760 |
| Persons per household, 2016-2020 | 2.27 |
| Living in same house 1 year ago, percent of persons age 1 year+, 2016-2020 | 81.1% |
| Language other than English spoken at home, percent of persons age 5 years+, 2016-2020 | 21.1% |
| Computer and Internet Use | |
| Households with a computer, percent, 2016-2020 | 97.9% |
| Households with a broadband Internet subscription, percent, 2016-2020 | 95.6% |
| Education | |
| High school graduate or higher, percent of persons age 25 years+, 2016-2020 | 94.0% |
| Bachelor’s degree or higher, percent of persons age 25 years+, 2016-2020 | 55.7% |
| Health | |
| With a disability, under age 65 years, percent, 2016-2020 | 6.2% |
| Persons without health insurance, under age 65 years, percent | 13.8% |
| Economy | |
| In civilian labor force, total, percent of population age 16 years+, 2016-2020 | 77.8% |
| In civilian labor force, female, percent of population age 16 years+, 2016-2020 | 72.9% |
| Total accommodation and food services sales, 2012 ($1,000)(c) | 152259 |
| Total health care and social assistance receipts/revenue, 2012 ($1,000)(c) | 293700 |
| Total manufacturers shipments, 2012 ($1,000)(c) | 208663 |
| Total retail sales, 2012 ($1,000)(c) | 1028830 |
| Total retail sales per capita, 2012(c) | $19,541 |
| Transportation | |
| Mean travel time to work (minutes), workers age 16 years+, 2016-2020 | 29 |
| Income & Poverty | |
| Median household income (in 2020 dollars), 2016-2020 | $77,713 |
| Per capita income in past 12 months (in 2020 dollars), 2016-2020 | $48,063 |
| Persons in poverty, percent | 8.2% |
| Businesses Businesses | |
| Total employer establishments, 2020 | X |
| Total employment, 2020 | X |
| Total annual payroll, 2020 ($1,000) | X |
| Total employment, percent change, 2019-2020 | X |
| Total nonemployer establishments, 2018 | X |
| All firms, 2012 | 6575 |
| Men-owned firms, 2012 | 3108 |
| Women-owned firms, 2012 | 2808 |
| Minority-owned firms, 2012 | 2970 |
| Nonminority-owned firms, 2012 | 3230 |
| Veteran-owned firms, 2012 | 687 |
| Nonveteran-owned firms, 2012 | 5483 |
| Geography | |
| Population per square mile, 2010 | 3339.5 |
| Land area in square miles, 2010 | 15.35 |