The City of Marietta announced a handy tool for finding a parking spot around Marietta Square. It identifies the free and paid locations to park in the square and the immediately surrounding area, and color codes the locations so you can tell whether it’s a free or paid spot.
Here’s the announcement from the city’s website reprinted below, containing the link to the handy map.
“MARIETTA – The City of Marietta is pleased to announce that it has made it easier to locate both free and paid parking lots on and around the Marietta Square.
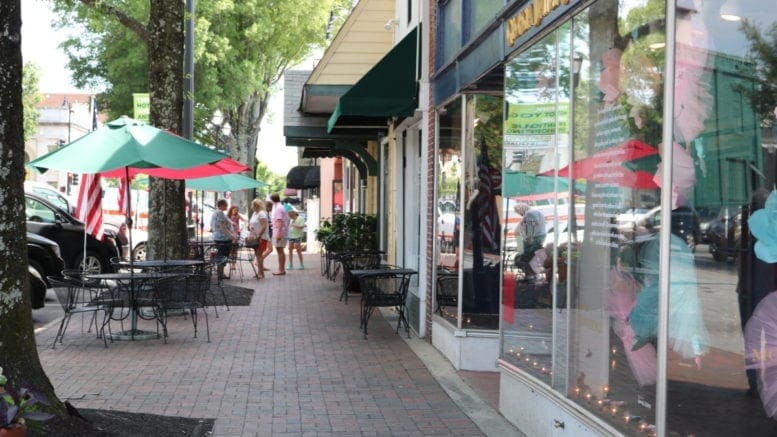
“The Marietta Square is a thriving entertainment, restaurant, retail, service, specialty, and office use destination for local and visiting patrons. Square parking options available to the public include 3,237 spaces – three decks with 1,520 spaces, 336 on-street spaces, and 1,381 spaces within 26 private lots. Since November 2018, 497 newly available parking spaces have been added to the downtown for public use.
“This parking map information will benefit residents, visitors and business owners and make parking hassle-free. Please visit our website as you head to the Square to find the best parking spot for your visit.”
About the City of Marietta
The City of Marietta is the county seat of Cobb County. The latest estimate from the U.S. Census Bureau puts the population of the city at 60,867 which makes it the largest city in Cobb County by population.
However, the city is in a neck-and-neck race with fast-growing Smyrna, whose population was 56,666 at the last estimate.
Here are a few fast facts from the Census Bureau
| Marietta city, Georgia | |
| People | |
| Population, Census, April 1, 2020 | 60972 |
| Population, Census, April 1, 2010 | 56579 |
| Age and Sex | |
| Persons under 5 years, percent | 6.7% |
| Persons under 18 years, percent | 21.8% |
| Persons 65 years and over, percent | 13.2% |
| Female persons, percent | 49.9% |
| Race and Hispanic Origin | |
| White alone, percent | 53.4% |
| Black or African American alone, percent(a) | 32.3% |
| American Indian and Alaska Native alone, percent(a) | 0.6% |
| Asian alone, percent(a) | 1.9% |
| Native Hawaiian and Other Pacific Islander alone, percent(a) | 0.0% |
| Two or More Races, percent | 4.7% |
| Hispanic or Latino, percent(b) | 15.7% |
| White alone, not Hispanic or Latino, percent | 46.4% |
| Population Characteristics | |
| Veterans, 2016-2020 | 2678 |
| Foreign born persons, percent, 2016-2020 | 16.6% |
| Housing | |
| Owner-occupied housing unit rate, 2016-2020 | 44.0% |
| Median value of owner-occupied housing units, 2016-2020 | $310,100 |
| Median selected monthly owner costs -with a mortgage, 2016-2020 | $1,856 |
| Median selected monthly owner costs -without a mortgage, 2016-2020 | $526 |
| Median gross rent, 2016-2020 | $1,145 |
| Families & Living Arrangements | |
| Households, 2016-2020 | 24148 |
| Persons per household, 2016-2020 | 2.39 |
| Living in same house 1 year ago, percent of persons age 1 year+, 2016-2020 | 77.9% |
| Language other than English spoken at home, percent of persons age 5 years+, 2016-2020 | 23.7% |
| Computer and Internet Use | |
| Households with a computer, percent, 2016-2020 | 95.1% |
| Households with a broadband Internet subscription, percent, 2016-2020 | 86.6% |
| Education | |
| High school graduate or higher, percent of persons age 25 years+, 2016-2020 | 88.6% |
| Bachelor’s degree or higher, percent of persons age 25 years+, 2016-2020 | 44.0% |
| Health | |
| With a disability, under age 65 years, percent, 2016-2020 | 6.3% |
| Persons without health insurance, under age 65 years, percent | 20.2% |
| Economy | |
| In civilian labor force, total, percent of population age 16 years+, 2016-2020 | 67.2% |
| In civilian labor force, female, percent of population age 16 years+, 2016-2020 | 61.2% |
| Total accommodation and food services sales, 2012 ($1,000)(c) | 264544 |
| Total health care and social assistance receipts/revenue, 2012 ($1,000)(c) | 1584232 |
| Total manufacturers shipments, 2012 ($1,000)(c) | 1129407 |
| Total retail sales, 2012 ($1,000)(c) | 1976915 |
| Total retail sales per capita, 2012(c) | $33,875 |
| Transportation | |
| Mean travel time to work (minutes), workers age 16 years+, 2016-2020 | 28.5 |
| Income & Poverty | |
| Median household income (in 2020 dollars), 2016-2020 | $59,594 |
| Per capita income in past 12 months (in 2020 dollars), 2016-2020 | $36,112 |
| Persons in poverty, percent | 14.1% |
| Businesses | |
| All firms, 2012 | 10501 |
| Men-owned firms, 2012 | 4934 |
| Women-owned firms, 2012 | 4186 |
| Minority-owned firms, 2012 | 4286 |
| Nonminority-owned firms, 2012 | 5502 |
| Veteran-owned firms, 2012 | 1015 |
| Nonveteran-owned firms, 2012 | 8663 |
| Geography | |
| Population per square mile, 2010 | 2451.4 |
| Land area in square miles, 2010 | 23.08 |