If you’re looking for a Spring event when the freezing weather we’ve been having here in Cobb County has finally past, and you’re beginning to get the gardening urge, Keep Smyrna Beautiful has an event for you! As a bonus, your ticket cost will help improve Smyrna’s overall environment.
The Smyrna Garden Tour returns on Saturday, May 6, 2023. The tour raises money for student scholarships and supports Keep Smyrna Beautiful’s programs “to end littering, reduce waste, promote recycling, and beautify Smyrna.”
According to the event’s press release, “Ticketholders will have the opportunity to take a self-guided tour of five of Smyrna’s most beautiful, private gardens located throughout the city. Last year’s gardens were an eclectic mix of size and personality, ranging from a mature, sprawling oasis to a young garden still finding its identity—and everything in between.”
“We’re so excited to have another group of diverse gardens this year,” said Keep Smyrna Beautiful Board Chair, Phyllis Owens. “Visitors will get great ideas for sloped lots, shade locations, vegetable gardening, and more.”
“This event allows residents to connect to each other and learn from each other. For each person who takes an idea and implements it, Smyrna wins. Plus, every dollar earned goes back into the community,” she said.
Tickets for the tour are $20 in advance and $25 the day of the event. You can purchase them by visiting Eventbrite.com. Paper tickets are available for purchase at the Smyrna Recycling Center and Vickery Hardware.
About the City of Smyrna
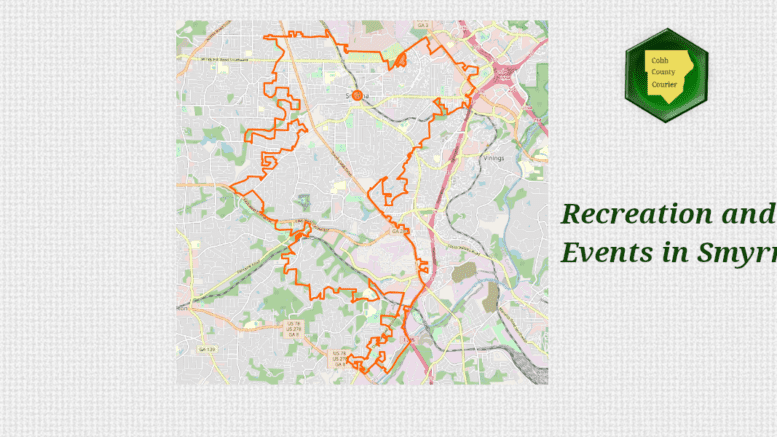
View Larger Map
Smyrna is the third-largest city in Cobb County, after newly incorporated Mableton, and county seat Marietta.
Smyrna was incorporated by an act of the Georgia legislature in 1872. To see a copy of the original incorporation legislation, follow this link.
The U.S. Census Bureau gives the latest quick facts about Smyrna:
| Smyrna city, Georgia | |
| Population Estimates, July 1 2021, (V2021) | 55,685 |
| PeoplePopulation | |
| Population Estimates, July 1 2021, (V2021) | 55,685 |
| Population estimates base, April 1, 2020, (V2021) | 55,689 |
| Population, percent change – April 1, 2020 (estimates base) to July 1, 2021, (V2021) | 0.0% |
| Population, Census, April 1, 2020 | 55663 |
| Population, Census, April 1, 2010 | 51271 |
| Age and Sex | |
| Persons under 5 years, percent | 7.8% |
| Persons under 18 years, percent | 23.2% |
| Persons 65 years and over, percent | 9.3% |
| Female persons, percent | 53.0% |
| Race and Hispanic Origin | |
| White alone, percent | 46.8% |
| Black or African American alone, percent(a) | 33.2% |
| American Indian and Alaska Native alone, percent(a) | 0.3% |
| Asian alone, percent(a) | 8.2% |
| Native Hawaiian and Other Pacific Islander alone, percent(a) | 0.3% |
| Two or More Races, percent | 4.5% |
| Hispanic or Latino, percent(b) | 13.6% |
| White alone, not Hispanic or Latino, percent | 42.9% |
| Population Characteristics | |
| Veterans, 2016-2020 | 2352 |
| Foreign born persons, percent, 2016-2020 | 16.5% |
| Housing | |
| Housing units, July 1, 2021, (V2021) | X |
| Owner-occupied housing unit rate, 2016-2020 | 55.5% |
| Median value of owner-occupied housing units, 2016-2020 | $309,000 |
| Median selected monthly owner costs -with a mortgage, 2016-2020 | $1,871 |
| Median selected monthly owner costs -without a mortgage, 2016-2020 | $471 |
| Median gross rent, 2016-2020 | $1,326 |
| Building permits, 2021 | X |
| Families & Living Arrangements | |
| Households, 2016-2020 | 24760 |
| Persons per household, 2016-2020 | 2.27 |
| Living in same house 1 year ago, percent of persons age 1 year+, 2016-2020 | 81.1% |
| Language other than English spoken at home, percent of persons age 5 years+, 2016-2020 | 21.1% |
| Computer and Internet Use | |
| Households with a computer, percent, 2016-2020 | 97.9% |
| Households with a broadband Internet subscription, percent, 2016-2020 | 95.6% |
| Education | |
| High school graduate or higher, percent of persons age 25 years+, 2016-2020 | 94.0% |
| Bachelor’s degree or higher, percent of persons age 25 years+, 2016-2020 | 55.7% |
| Health | |
| With a disability, under age 65 years, percent, 2016-2020 | 6.2% |
| Persons without health insurance, under age 65 years, percent | 13.8% |
| Economy | |
| In civilian labor force, total, percent of population age 16 years+, 2016-2020 | 77.8% |
| In civilian labor force, female, percent of population age 16 years+, 2016-2020 | 72.9% |
| Total accommodation and food services sales, 2012 ($1,000)(c) | 152259 |
| Total health care and social assistance receipts/revenue, 2012 ($1,000)(c) | 293700 |
| Total manufacturers shipments, 2012 ($1,000)(c) | 208663 |
| Total retail sales, 2012 ($1,000)(c) | 1028830 |
| Total retail sales per capita, 2012(c) | $19,541 |
| Transportation | |
| Mean travel time to work (minutes), workers age 16 years+, 2016-2020 | 29 |
| Income & Poverty | |
| Median household income (in 2020 dollars), 2016-2020 | $77,713 |
| Per capita income in past 12 months (in 2020 dollars), 2016-2020 | $48,063 |
| Persons in poverty, percent | 8.2% |
| BusinessesBusinesses | |
| Total employer establishments, 2020 | X |
| Total employment, 2020 | X |
| Total annual payroll, 2020 ($1,000) | X |
| Total employment, percent change, 2019-2020 | X |
| Total nonemployer establishments, 2018 | X |
| All firms, 2012 | 6575 |
| Men-owned firms, 2012 | 3108 |
| Women-owned firms, 2012 | 2808 |
| Minority-owned firms, 2012 | 2970 |
| Nonminority-owned firms, 2012 | 3230 |
| Veteran-owned firms, 2012 | 687 |
| Nonveteran-owned firms, 2012 | 5483 |
| Geography | |
| Population per square mile, 2010 | 3339.5 |
| Land area in square miles, 2010 | 15.35 |