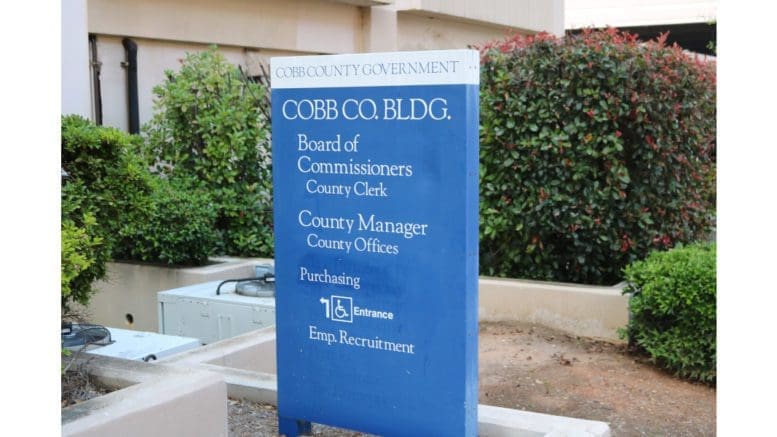
Round 2 of the public meetings to get community engagement for the proposed Unified Development Code begins on December 6 with a meeting at the Windy Hill Community Center.
The Uniform Development Code is intended to make Cobb County’s ordinances regarding zoning and other development regulations consistent.
A Code Assessment Public Draft goes into a great deal of detail about the proposed changes to county code, plus an overview for why the Board of Commissioners and county staff thought it necessary to take on this project.
If you plan on attending one of the meetings, the web site https://www.cobbcountyudc.com has a great deal of information about the state of the project.
The web site give the following overview of the project:
“Cobb County’s development regulations were adopted in the 1970s to guide land use and development for a county of approximately 200,000 residents. Over the span of nearly 50 years, the regulations have been updated on an as-needed basis through a piecemeal approach, along with the Cobb County Development Standards.
“Because there has been no comprehensive review of the development regulations for decades, they are poorly organized, internally inconsistent, lack features of modern codes such as illustrations and an easy-to-understand structure, and thus fall short of adequately addressing the County’s growth challenges. In addition, they do not support the policies in the County’s 2040 Comprehensive Plan, which is also being updated in 2022.
“With nearly 800,000 residents and increased demand for housing, services, goods, industry, professional offices, education, recreational and lifestyle opportunities, the County is preparing a Unified Development Code (UDC) that will collect the development regulations scattered throughout the Code of Ordinances into a single, integrated, and easy-to-use document that best supports the county’s long-term plans to focus growth within identified activity centers while preserving the rural areas and existing residential neighborhoods that County residents treasure.”
Here is the upcoming meeting schedule:
- Wednesday, December 6, 6:00 – 8:00 pm
Windy Hill Community Center - Thursday, December 7, 6:00 – 8:00 pm
North Cobb Regional Library - Monday, December 11, 10:00 am – 12:00 pm
BOC Meeting Room, 100 Cherokee Street, Marietta - Tuesday, December 12, 10:00 am – 12:00 pm
West Cobb Senior Center - Tuesday, December 12, 6:00 – 8:00 pm
Thompson Park Community Center - Thursday, December 14, 6:00 – 8:00 pm
Mountain View Community Center
About Cobb County
Cobb County is the third most populous county in Georgia, smaller only than Fulton and Gwinnett counties.
The governing authority is the five-member Cobb County Board of Commissioners, which includes a Chairperson and four district commissioners.
The current board is:
| Chairwoman | Lisa Cupid |
| District 1 Commissioner | Keli Gambrill |
| District 2 Commissioner | Jerica Richardson |
| District 3 Commissioner | JoAnn Birrell |
| District 4 Commissioner | Monique Sheffield |
The U.S. Census Bureau gives the following quick facts about the county:
| PeoplePopulation | |
| Population Estimates, July 1 2021, (V2021) | 766,802 |
| Population estimates base, April 1, 2020, (V2021) | 766,149 |
| Population, percent change – April 1, 2020 (estimates base) to July 1, 2021, (V2021) | 0.1% |
| Population, Census, April 1, 2020 | 766149 |
| Population, Census, April 1, 2010 | 688078 |
| Age and Sex | |
| Persons under 5 years, percent | 5.6% |
| Persons under 18 years, percent | 22.7% |
| Persons 65 years and over, percent | 13.3% |
| Female persons, percent | 51.3% |
| Race and Hispanic Origin | |
| White alone, percent | 61.7% |
| Black or African American alone, percent(a) | 29.2% |
| American Indian and Alaska Native alone, percent(a) | 0.5% |
| Asian alone, percent(a) | 5.7% |
| Native Hawaiian and Other Pacific Islander alone, percent(a) | 0.1% |
| Two or More Races, percent | 2.8% |
| Hispanic or Latino, percent(b) | 13.7% |
| White alone, not Hispanic or Latino, percent | 50.2% |
| Population Characteristics | |
| Veterans, 2016-2020 | 40562 |
| Foreign born persons, percent, 2016-2020 | 15.6% |
| Housing | |
| Housing units, July 1, 2021, (V2021) | 311450 |
| Owner-occupied housing unit rate, 2016-2020 | 65.8% |
| Median value of owner-occupied housing units, 2016-2020 | $273,900 |
| Median selected monthly owner costs -with a mortgage, 2016-2020 | $1,672 |
| Median selected monthly owner costs -without a mortgage, 2016-2020 | $474 |
| Median gross rent, 2016-2020 | $1,264 |
| Building permits, 2021 | 3247 |
| Families & Living Arrangements | |
| Households, 2016-2020 | 283359 |
| Persons per household, 2016-2020 | 2.63 |
| Living in same house 1 year ago, percent of persons age 1 year+, 2016-2020 | 84.6% |
| Language other than English spoken at home, percent of persons age 5 years+, 2016-2020 | 20.5% |
| Computer and Internet Use | |
| Households with a computer, percent, 2016-2020 | 97.2% |
| Households with a broadband Internet subscription, percent, 2016-2020 | 93.3% |
| Education | |
| High school graduate or higher, percent of persons age 25 years+, 2016-2020 | 92.6% |
| Bachelor’s degree or higher, percent of persons age 25 years+, 2016-2020 | 48.4% |
| Health | |
| With a disability, under age 65 years, percent, 2016-2020 | 6.2% |
| Persons without health insurance, under age 65 years, percent | 13.8% |
| Economy | |
| In civilian labor force, total, percent of population age 16 years+, 2016-2020 | 69.6% |
| In civilian labor force, female, percent of population age 16 years+, 2016-2020 | 64.3% |
| Total accommodation and food services sales, 2017 ($1,000)(c) | 2056579 |
| Total health care and social assistance receipts/revenue, 2017 ($1,000)(c) | 5569500 |
| Total transportation and warehousing receipts/revenue, 2017 ($1,000)(c) | 1536858 |
| Total retail sales, 2017 ($1,000)(c) | 18543691 |
| Total retail sales per capita, 2017(c) | $24,615 |
| Transportation | |
| Mean travel time to work (minutes), workers age 16 years+, 2016-2020 | 31.2 |
| Income & Poverty | |
| Median household income (in 2020 dollars), 2016-2020 | $80,830 |
| Per capita income in past 12 months (in 2020 dollars), 2016-2020 | $41,480 |
| Persons in poverty, percent | 9.2% |
| BusinessesBusinesses | |
| Total employer establishments, 2020 | 21492 |
| Total employment, 2020 | 358927 |
| Total annual payroll, 2020 ($1,000) | 21780372 |
| Total employment, percent change, 2019-2020 | -0.3% |
| Total nonemployer establishments, 2019 | 86497 |
| All employer firms, Reference year 2017 | 17066 |
| Men-owned employer firms, Reference year 2017 | 10386 |
| Women-owned employer firms, Reference year 2017 | 3537 |
| Minority-owned employer firms, Reference year 2017 | 3058 |
| Nonminority-owned employer firms, Reference year 2017 | 12177 |
| Veteran-owned employer firms, Reference year 2017 | 1204 |
| Nonveteran-owned employer firms, Reference year 2017 | 13909 |
| GeographyGeography | |
| Population per square mile, 2020 | 2254.8 |
| Population per square mile, 2010 | 2026.4 |
| Land area in square miles, 2020 | 339.78 |
| Land area in square miles, 2010 | 339.55 |