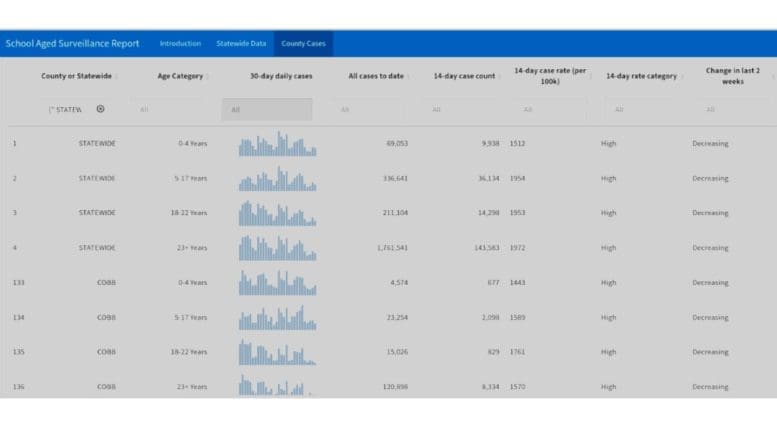
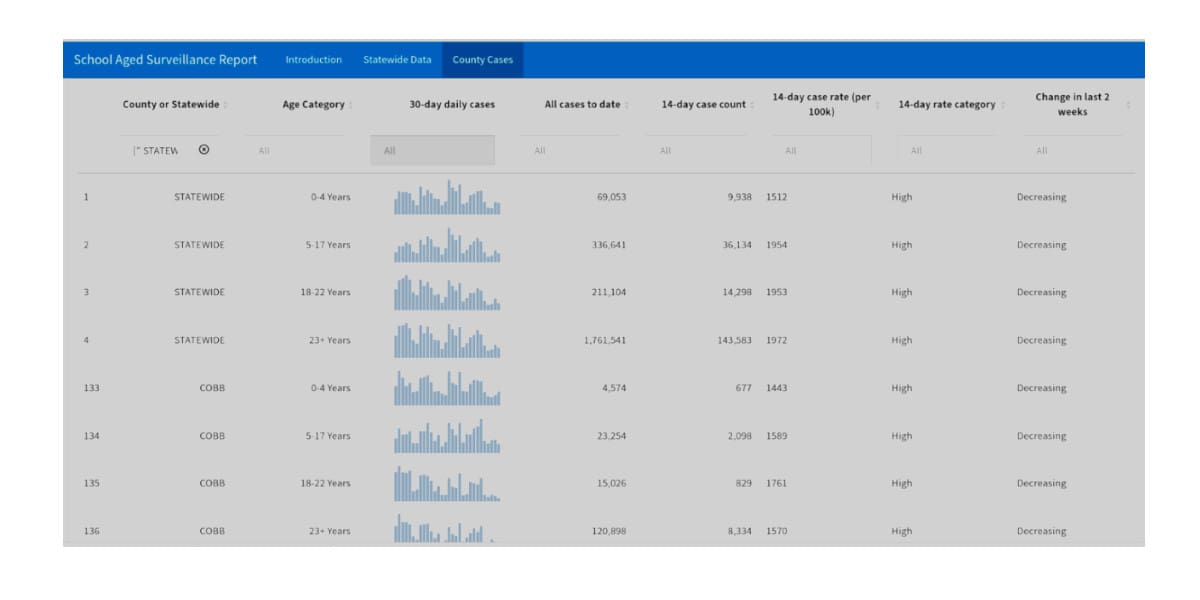
For the first time in weeks, all three categories of pre-school and school-aged Cobb residents in the Georgia Department of Public Health’s weekly COVID School Aged Surveillance Report show a decreasing trend for the past week.
But all three are still well above the threshold considered high community transmission.
Among preschoolers in the 0-4 age range there were 677 new cases of COVID-19 in Cobb, for a 14-day case rate per 100,000 of population of 1,443.
Among public-school-aged residents in the 5-17 age range there were 2,098 new cases of COVID-19 in Cobb, for a 14-day case rate per 100,000 of population of 1,589.
And finally, in the undergraduate college-age range of 18-22 years old there were 829 new cases of COVID-19 in Cobb, for a 14-day case rate per 100,000 of population of 1,761.
Statewide figures also decreased in those categories, although the statewide case rate per 100,000 of population were higher than Cobb’s in the comparable age ranges.
About the GDPH School Aged COVID-19 Data Report
The documentation for the School Aged COVID-19 Data Report describes the use of the data as follows:
The data in this report can be used to assess the extent of COVID-19 transmission among preschool/daycare aged children (0-4 years), K-12 school aged children (5-17 years), and college/professional school aged adults (18-22 years) in Georgia. Click on the above tabs to see statewide and county level COVID-19 data. This report is updated weekly. Please consult additional resources to understand trends and other factors affecting your county.
For a complete list of the reports with links, follow this link.
The numbers in this report were taken from the Georgia Department of Public Health COVID Daily Status Report, from the summary posted on the CDC County View data tracker, and from the Georgia Hospital Bed and Ventilator use report.
Cobb County numbers
The Georgia Department of Public Health displays its COVID statistics based on 14-day blocks.
New cases in Cobb over the past 14 days:
14-day case rate per 100,000 of population:
Number of Cases in Cobb since the pandemic began:
Cases per 100,000 of population since the pandemic began:
Cobb numbers and rate from the CDC County View
The Centers for Disease Control and Prevention (CDC) gets its numbers from the Georgia Department of Public Health, but presents them in 7-day blocks rather than the 14-day blocks presented by the GDPH.
7-day Metrics
7-day percentage change
Statewide numbers
Hospital bed and ventilator report
Region N which includes Cherokee, Cobb, Douglas and Paulding counties, has:
For more information on COVID in Cobb County and statewide
Cobb & Douglas Public Health runs the case rate on their home page, although it is not updated frequently.
Visit the Cobb & Douglas Public Health home page by following this link
A more frequently updated summary of the statistics on COVID for Cobb County is the CDC’s County View page for Cobb County. The numbers come from the Georgia Department of Public Health but are displayed in a much easier-to-read way than the sprawling GDPH website. From this page you can get the one-week figures on the number of new cases, case rate per 100,000 of population, hospitalizations, deaths, and the percentage change from the previous 7-day period. It also includes data on testing and vaccination rates.
Visit the CDC County View page for Cobb County by following this link
The Georgia Department of Public Health publishes a daily status report on the pandemic every afternoon at around 3 p.m. It’s a comprehensive report with extensive data and charts arranged statewide and by county, that also includes age breakdowns, racial demographics, and data on vaccination and testing.
It isn’t the easiest system to navigate, but it’s worth spending time learning how to use if you’re interested in getting the latest statewide and local data on the state of COVID-19.
Visit the Georgia Department of Public Health Daily Status Report by following this link
To get an overview of how much the pandemic is stressing the hospital systems in terms of ER visits, hospital bed capacity, and ventilator use, there is a Hospital Bed and Ventilator Use report with interactive maps. The map is organized by hospital region, and Cobb County is part of Region N.
Visit the Georgia Hospital Beds and Ventilator Report by following this link
To get data on what percentage of patients in Georgia hospitals were admitted for COVID-19 versus all other causes, there is a Georgia Medical Facility Patient Census. It also reports numbers by statewide and hospital region.
Visit the Georgia Medical Facility Patient Census by following this link