by Larry Felton Johnson
This year many homeowners in Cobb County got an unpleasant jolt as reassessments of home values brought about an increase in the tax bill for most Cobb homeowners.
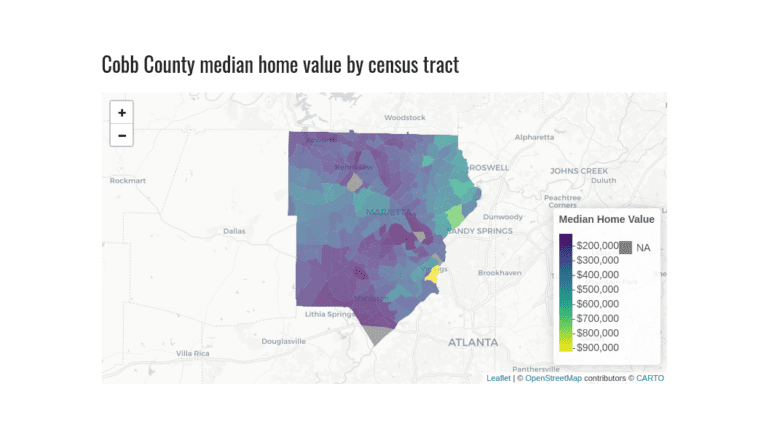
This article, after an explanation of where the numbers come from, will present you with an interactive Cobb County map of median home values by census tract from the census bureau’s 2021 5-year American Community Survey.
There are two limitations to be aware of before diving in to the numbers. One is that the ACS is a survey, meaning that the subjects in the survey report their best estimate of the value of their home.
The second is that there is always a time lag with ACS numbers. These figures are for a five-year period ending in 2021.
But that said, the survey is useful since it focuses on a smaller unit than zip codes, and is very good for comparing relative prices within the county (below I write that there are no surprises. Vinings near the river has the highest values, a part of Austell, Fair Oaks, and the Franklin Gateway area have the lowest.
It’s the first in a series called Cobb by the Numbers. We did a similar series from 2018 to 2021, and decided it’s worth revisiting with the latest numbers from the census and other sources of data.
If you want to skip the explanation, and dive straight into the numbers for Cobb County, scroll down to the section beginning with the header “Cobb County median home value by census tract”. Then you can click and scroll until you find a part of the county you’re interested in.
The values come from the American Community Survey (ACS) completed in 2021, and are the averages over a 5-year period.
The ACS, while it doesn’t survey the entire population, has a much more extensive questionnaire, and is conducted throughout each year, with the results released at one and five-year intervals.
In preparation for reporting on the decennial census, I began learning a statistical programming language called “R,” did a lot of reading on the Census Bureau website, and gathered data on home values from the American Community Survey.
The interactive map below was created in R, using census figures from the ACS.
What is the American Community Survey?
The American Community Survey is both more frequent and more comprehensive than the decennial census. Here’s a description of the ACS from the U.S. Census website. The ACS is:
- Conducted every month, every year
- Sent to a sample of addresses (about 3.5 million) in the 50 states, District of Columbia, and Puerto Rico
- Asks about topics not on the 2020 Census, such as education, employment, internet access, and transportation
- Provides current information to communities every year. It also provides local and national leaders with the information they need for programs, economic development, emergency management, and understanding local issues and conditions.
The decennial census, on the other hand, is:
- Conducted every ten years
- Counts every person living in the 50 states, District of Columbia, and the five U.S. territories
- Asks a shorter set of questions, such as age, sex, race, Hispanic origin, and owner/renter status
- Provides an official count of the population, which determines congressional representation. Also provides critical data that lawmakers and many others use to provide daily services, products, and support for communities.
Cobb County median home value by census tract
The map above shows the housing figures for the five-year American Community Survey ending in 2021, displayed as an interactive map. I’ll do a followup article tomorrow with the census tracts sorted by values.
Real Estate websites often give home prices based on zip code. Zip codes have limitations as an accurate picture of area housing. First, they span too large an area, often covering multiple neighborhoods with diverse characteristics that make drawing any conclusion about the community difficult. Second they often overlap county boundaries.
You can zoom in on the map to figure out the streets associated with different tracts, and click on a tract to get the name and average home prices, although the color-coding makes reading the street names a bit challenging.
You’ll notice that several tracts have N/A listed as the average value. The reason for this is the median home value statistics I used are for owner-occupied homes on less than ten acre lots. Dobbins ARB, and two areas with a great deal of industrial property account for the N/A tracts.
There aren’t many surprises. The most expensive homes are in the part of Vinings near Paces Ferry Road at the Chattahoochee River. The census tract of that Buckhead-adjacent neighborhood is 312.12 and the median home price there is $919,400.00.
The least expensive housing in Cobb is census tract off Austell Road near the East West Connector, and tracts in and around Fair Oaks and the nearby portion of Cobb Parkway.
Tomorrow I’ll follow up with tables that sort the tracts by both census tract ID and home value.