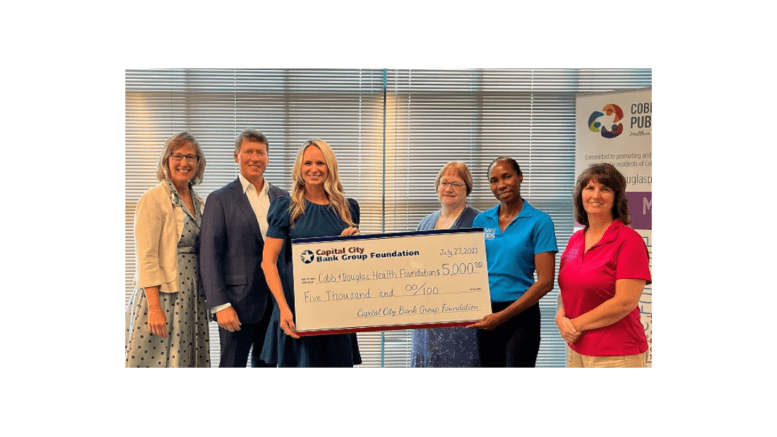
According to a news release from Cobb & Douglas Public Health, the Cobb & Douglas Health Foundation for Safe Kids Cobb County has been awarded a $5,000 grant from the Capital City Bank Group Foundation (CCBG).
The award was presented by Capital City Bank Cobb County Market President Ron King and Commercial Lender Betsy Madrerohon.
The grant will be used to provide Cobb families with infant-safe sleep education and equipment, including “portable cribs to distribute to families that need a safe sleep surface for their infant.”
“Safe Kids Cobb County greatly appreciates the generosity of the Capital City Bank Foundation and its dedication to supporting local initiatives,” said Melissa Chan-Leiba, Safe Kids Cobb Coordinator. “The funding will greatly help with the expansion of infant safe sleep education and will enable us to purchase and distribute portable cribs to families in Cobb County.”
About Safe Kids Cobb County
According to promotional materials from Cobb & Douglas Public Health:
Safe Kids Cobb County was created in 1991 to reduce the number of unintentional injuries of children. One of Safe Kids Cobb’s main initiatives is infant safe sleep education, as sleep-related deaths is the leading cause of preventable death of infants under 12 months in Cobb County.
About Cobb County
Cobb County is the third most populous county in Georgia, smaller only than Fulton and Gwinnett counties.
The governing authority is the five-member Cobb County Board of Commissioners, which includes a Chairperson and four district commissioners.
The current board is:
| Chairwoman | Lisa Cupid |
| District 1 Commissioner | Keli Gambrill |
| District 2 Commissioner | Jerica Richardson |
| District 3 Commissioner | JoAnn Birrell |
| District 4 Commissioner | Monique Sheffield |
The U.S. Census Bureau gives the following quick facts about the county:
| PeoplePopulation | |
| Population Estimates, July 1 2021, (V2021) | 766,802 |
| Population estimates base, April 1, 2020, (V2021) | 766,149 |
| Population, percent change – April 1, 2020 (estimates base) to July 1, 2021, (V2021) | 0.1% |
| Population, Census, April 1, 2020 | 766149 |
| Population, Census, April 1, 2010 | 688078 |
| Age and Sex | |
| Persons under 5 years, percent | 5.6% |
| Persons under 18 years, percent | 22.7% |
| Persons 65 years and over, percent | 13.3% |
| Female persons, percent | 51.3% |
| Race and Hispanic Origin | |
| White alone, percent | 61.7% |
| Black or African American alone, percent(a) | 29.2% |
| American Indian and Alaska Native alone, percent(a) | 0.5% |
| Asian alone, percent(a) | 5.7% |
| Native Hawaiian and Other Pacific Islander alone, percent(a) | 0.1% |
| Two or More Races, percent | 2.8% |
| Hispanic or Latino, percent(b) | 13.7% |
| White alone, not Hispanic or Latino, percent | 50.2% |
| Population Characteristics | |
| Veterans, 2016-2020 | 40562 |
| Foreign born persons, percent, 2016-2020 | 15.6% |
| Housing | |
| Housing units, July 1, 2021, (V2021) | 311450 |
| Owner-occupied housing unit rate, 2016-2020 | 65.8% |
| Median value of owner-occupied housing units, 2016-2020 | $273,900 |
| Median selected monthly owner costs -with a mortgage, 2016-2020 | $1,672 |
| Median selected monthly owner costs -without a mortgage, 2016-2020 | $474 |
| Median gross rent, 2016-2020 | $1,264 |
| Building permits, 2021 | 3247 |
| Families & Living Arrangements | |
| Households, 2016-2020 | 283359 |
| Persons per household, 2016-2020 | 2.63 |
| Living in same house 1 year ago, percent of persons age 1 year+, 2016-2020 | 84.6% |
| Language other than English spoken at home, percent of persons age 5 years+, 2016-2020 | 20.5% |
| Computer and Internet Use | |
| Households with a computer, percent, 2016-2020 | 97.2% |
| Households with a broadband Internet subscription, percent, 2016-2020 | 93.3% |
| Education | |
| High school graduate or higher, percent of persons age 25 years+, 2016-2020 | 92.6% |
| Bachelor’s degree or higher, percent of persons age 25 years+, 2016-2020 | 48.4% |
| Health | |
| With a disability, under age 65 years, percent, 2016-2020 | 6.2% |
| Persons without health insurance, under age 65 years, percent | 13.8% |
| Economy | |
| In civilian labor force, total, percent of population age 16 years+, 2016-2020 | 69.6% |
| In civilian labor force, female, percent of population age 16 years+, 2016-2020 | 64.3% |
| Total accommodation and food services sales, 2017 ($1,000)(c) | 2056579 |
| Total health care and social assistance receipts/revenue, 2017 ($1,000)(c) | 5569500 |
| Total transportation and warehousing receipts/revenue, 2017 ($1,000)(c) | 1536858 |
| Total retail sales, 2017 ($1,000)(c) | 18543691 |
| Total retail sales per capita, 2017(c) | $24,615 |
| Transportation | |
| Mean travel time to work (minutes), workers age 16 years+, 2016-2020 | 31.2 |
| Income & Poverty | |
| Median household income (in 2020 dollars), 2016-2020 | $80,830 |
| Per capita income in past 12 months (in 2020 dollars), 2016-2020 | $41,480 |
| Persons in poverty, percent | 9.2% |
| BusinessesBusinesses | |
| Total employer establishments, 2020 | 21492 |
| Total employment, 2020 | 358927 |
| Total annual payroll, 2020 ($1,000) | 21780372 |
| Total employment, percent change, 2019-2020 | -0.3% |
| Total nonemployer establishments, 2019 | 86497 |
| All employer firms, Reference year 2017 | 17066 |
| Men-owned employer firms, Reference year 2017 | 10386 |
| Women-owned employer firms, Reference year 2017 | 3537 |
| Minority-owned employer firms, Reference year 2017 | 3058 |
| Nonminority-owned employer firms, Reference year 2017 | 12177 |
| Veteran-owned employer firms, Reference year 2017 | 1204 |
| Nonveteran-owned employer firms, Reference year 2017 | 13909 |
| GeographyGeography | |
| Population per square mile, 2020 | 2254.8 |
| Population per square mile, 2010 | 2026.4 |
| Land area in square miles, 2020 | 339.78 |
| Land area in square miles, 2010 | 339.55 |