There will be virtual public information meeting about a study to determine the effectiveness of Cobb County’s supplier diversity program.
The meeting will take place November 9 at 12 p.m.
The county’s public information release describes the purpose of the meeting as follows:
The Disparity Study, conducted by Griffin & Strong P.C., will look at the past five years of contracts in construction, goods, and services — including architecture and engineering services — then recommend modifications or adjustments if needed. The Study will also examine the use of Minority and Women-Owned Business Enterprises and Service-Disabled Veteran-Owned Small Businesses.
You can register in advance at https://bit.ly/44QhYcz but advance registration is not required to attend the meeting.
For any inquiries or issues, please email the organizers of the event at cobbcountystudy@gspclaw.com
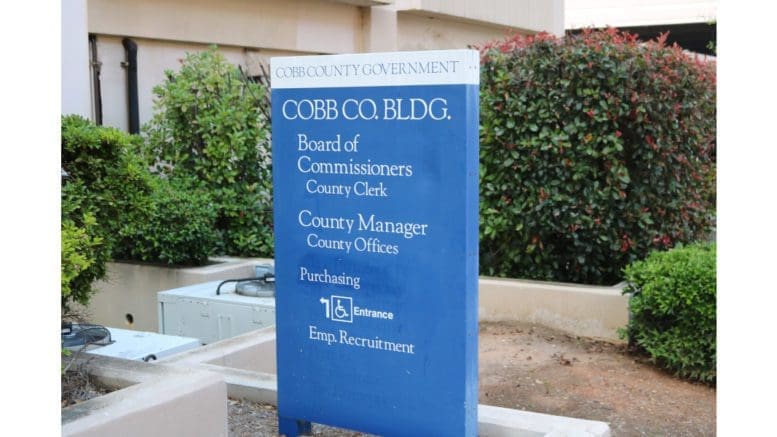
About Cobb County
Cobb County is the third most populous county in Georgia, smaller only than Fulton and Gwinnett counties.
The governing authority is the five-member Cobb County Board of Commissioners, which includes a Chairperson and four district commissioners.
The current board is:
| Chairwoman | Lisa Cupid |
| District 1 Commissioner | Keli Gambrill |
| District 2 Commissioner | Jerica Richardson |
| District 3 Commissioner | JoAnn Birrell |
| District 4 Commissioner | Monique Sheffield |
The U.S. Census Bureau gives the following quick facts about the county:
| PeoplePopulation | |
| Population Estimates, July 1 2021, (V2021) | 766,802 |
| Population estimates base, April 1, 2020, (V2021) | 766,149 |
| Population, percent change – April 1, 2020 (estimates base) to July 1, 2021, (V2021) | 0.1% |
| Population, Census, April 1, 2020 | 766149 |
| Population, Census, April 1, 2010 | 688078 |
| Age and Sex | |
| Persons under 5 years, percent | 5.6% |
| Persons under 18 years, percent | 22.7% |
| Persons 65 years and over, percent | 13.3% |
| Female persons, percent | 51.3% |
| Race and Hispanic Origin | |
| White alone, percent | 61.7% |
| Black or African American alone, percent(a) | 29.2% |
| American Indian and Alaska Native alone, percent(a) | 0.5% |
| Asian alone, percent(a) | 5.7% |
| Native Hawaiian and Other Pacific Islander alone, percent(a) | 0.1% |
| Two or More Races, percent | 2.8% |
| Hispanic or Latino, percent(b) | 13.7% |
| White alone, not Hispanic or Latino, percent | 50.2% |
| Population Characteristics | |
| Veterans, 2016-2020 | 40562 |
| Foreign born persons, percent, 2016-2020 | 15.6% |
| Housing | |
| Housing units, July 1, 2021, (V2021) | 311450 |
| Owner-occupied housing unit rate, 2016-2020 | 65.8% |
| Median value of owner-occupied housing units, 2016-2020 | $273,900 |
| Median selected monthly owner costs -with a mortgage, 2016-2020 | $1,672 |
| Median selected monthly owner costs -without a mortgage, 2016-2020 | $474 |
| Median gross rent, 2016-2020 | $1,264 |
| Building permits, 2021 | 3247 |
| Families & Living Arrangements | |
| Households, 2016-2020 | 283359 |
| Persons per household, 2016-2020 | 2.63 |
| Living in same house 1 year ago, percent of persons age 1 year+, 2016-2020 | 84.6% |
| Language other than English spoken at home, percent of persons age 5 years+, 2016-2020 | 20.5% |
| Computer and Internet Use | |
| Households with a computer, percent, 2016-2020 | 97.2% |
| Households with a broadband Internet subscription, percent, 2016-2020 | 93.3% |
| Education | |
| High school graduate or higher, percent of persons age 25 years+, 2016-2020 | 92.6% |
| Bachelor’s degree or higher, percent of persons age 25 years+, 2016-2020 | 48.4% |
| Health | |
| With a disability, under age 65 years, percent, 2016-2020 | 6.2% |
| Persons without health insurance, under age 65 years, percent | 13.8% |
| Economy | |
| In civilian labor force, total, percent of population age 16 years+, 2016-2020 | 69.6% |
| In civilian labor force, female, percent of population age 16 years+, 2016-2020 | 64.3% |
| Total accommodation and food services sales, 2017 ($1,000)(c) | 2056579 |
| Total health care and social assistance receipts/revenue, 2017 ($1,000)(c) | 5569500 |
| Total transportation and warehousing receipts/revenue, 2017 ($1,000)(c) | 1536858 |
| Total retail sales, 2017 ($1,000)(c) | 18543691 |
| Total retail sales per capita, 2017(c) | $24,615 |
| Transportation | |
| Mean travel time to work (minutes), workers age 16 years+, 2016-2020 | 31.2 |
| Income & Poverty | |
| Median household income (in 2020 dollars), 2016-2020 | $80,830 |
| Per capita income in past 12 months (in 2020 dollars), 2016-2020 | $41,480 |
| Persons in poverty, percent | 9.2% |
| BusinessesBusinesses | |
| Total employer establishments, 2020 | 21492 |
| Total employment, 2020 | 358927 |
| Total annual payroll, 2020 ($1,000) | 21780372 |
| Total employment, percent change, 2019-2020 | -0.3% |
| Total nonemployer establishments, 2019 | 86497 |
| All employer firms, Reference year 2017 | 17066 |
| Men-owned employer firms, Reference year 2017 | 10386 |
| Women-owned employer firms, Reference year 2017 | 3537 |
| Minority-owned employer firms, Reference year 2017 | 3058 |
| Nonminority-owned employer firms, Reference year 2017 | 12177 |
| Veteran-owned employer firms, Reference year 2017 | 1204 |
| Nonveteran-owned employer firms, Reference year 2017 | 13909 |
| GeographyGeography | |
| Population per square mile, 2020 | 2254.8 |
| Population per square mile, 2010 | 2026.4 |
| Land area in square miles, 2020 | 339.78 |
| Land area in square miles, 2010 | 339.55 |