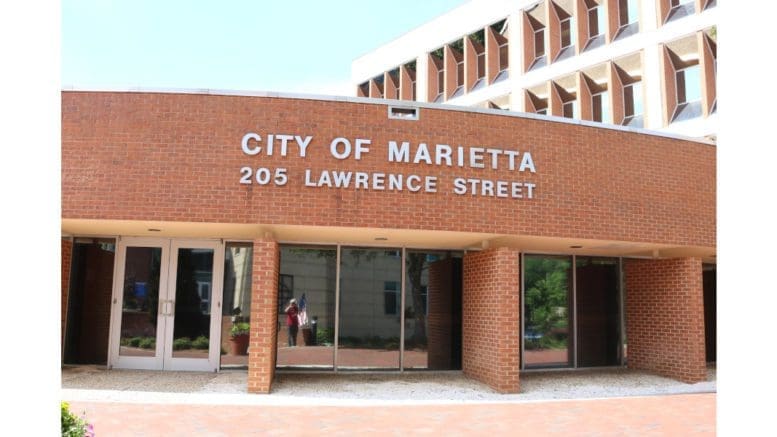
Marietta Mayor Steve Tumlin presented awards to a staff member and a student from each school in Marietta City Schools, during the 6th Annual Mayor’s Awards.
We’ve reprinted the descriptions of the staff and student awards, and the list of recipients from the City of Marietta website:
The “Be Somebody Award” is given to a staff member who demonstrates the values of making a positive difference in the lives of their students and the Marietta Community.
The “Blue Devil Award” is given to a student who demonstrates a positive attitude, exceptional character, and a great work ethic.
Be Somebody Award:
Anthony Pearson, AL Burruss Elementary
Karen “Missy” Bain, Dunleith Elementary
Nicole Weber, Sawyer Road Elementary
Erin Maziek-Babb, Hickory Hills Elementary
Bailiey Moore-Smith, Lockheed Elementary
Erica Turnbull, Park Street Elementary
Morgan Carden, West Side Elementary
Mandy Scott, Marietta Center for Advanced Academics
Andrea Bradley, Early Learning Center
Tootie Berniard Marietta Sixth Grade Academy
Mary-Darlene Finney, Marietta Middle School
Terrance Duke, Marietta High School
Blue Devil Award:
Iker Hernandez Lara, AL Burruss Elementary
Samantha Hernandez, Dunleith Elementary
Andrew England, Sawyer Road Elementary
Henry Watson, Hickory Hills Elementary
Maribel Ramirez, Lockheed Elementary
Omar Munoz, Park Street Elementary
Selma Larsgaard, West Side Elementary
Tyler Kate “TK” Westbrook, Marietta Center for Advanced Academics
Abigail Cuchil, Early Learning Center
Mary Herrin., Marietta Sixth Grade Academy
Caleigh Mitchell, Marietta Middle School
Angeles Mendez, Marietta High School
About the City of Marietta
The City of Marietta is the county seat of Cobb County. The latest estimate from the U.S. Census Bureau puts the population of the city at 60,867 which makes it the second largest city in Cobb County by population, smaller only than the newly incorporated City of Mableton.
Here are a few quick facts from the Census Bureau
| Marietta city, Georgia | |
| Population, Census, April 1, 2020 | 60972 |
| Population, Census, April 1, 2010 | 56579 |
| Age and Sex | |
| Persons under 5 years, percent | 6.7% |
| Persons under 18 years, percent | 21.8% |
| Persons 65 years and over, percent | 13.2% |
| Female persons, percent | 49.9% |
| Race and Hispanic Origin | |
| White alone, percent | 53.4% |
| Black or African American alone, percent(a) | 32.3% |
| American Indian and Alaska Native alone, percent(a) | 0.6% |
| Asian alone, percent(a) | 1.9% |
| Native Hawaiian and Other Pacific Islander alone, percent(a) | 0.0% |
| Two or More Races, percent | 4.7% |
| Hispanic or Latino, percent(b) | 15.7% |
| White alone, not Hispanic or Latino, percent | 46.4% |
| Population Characteristics | |
| Veterans, 2016-2020 | 2678 |
| Foreign born persons, percent, 2016-2020 | 16.6% |
| Housing | |
| Owner-occupied housing unit rate, 2016-2020 | 44.0% |
| Median value of owner-occupied housing units, 2016-2020 | $310,100 |
| Median selected monthly owner costs -with a mortgage, 2016-2020 | $1,856 |
| Median selected monthly owner costs -without a mortgage, 2016-2020 | $526 |
| Median gross rent, 2016-2020 | $1,145 |
| Families & Living Arrangements | |
| Households, 2016-2020 | 24148 |
| Persons per household, 2016-2020 | 2.39 |
| Living in same house 1 year ago, percent of persons age 1 year+, 2016-2020 | 77.9% |
| Language other than English spoken at home, percent of persons age 5 years+, 2016-2020 | 23.7% |
| Computer and Internet Use | |
| Households with a computer, percent, 2016-2020 | 95.1% |
| Households with a broadband Internet subscription, percent, 2016-2020 | 86.6% |
| Education | |
| High school graduate or higher, percent of persons age 25 years+, 2016-2020 | 88.6% |
| Bachelor’s degree or higher, percent of persons age 25 years+, 2016-2020 | 44.0% |
| Health | |
| With a disability, under age 65 years, percent, 2016-2020 | 6.3% |
| Persons without health insurance, under age 65 years, percent | 20.2% |
| Economy | |
| In civilian labor force, total, percent of population age 16 years+, 2016-2020 | 67.2% |
| In civilian labor force, female, percent of population age 16 years+, 2016-2020 | 61.2% |
| Total accommodation and food services sales, 2012 ($1,000)(c) | 264544 |
| Total health care and social assistance receipts/revenue, 2012 ($1,000)(c) | 1584232 |
| Total manufacturers shipments, 2012 ($1,000)(c) | 1129407 |
| Total retail sales, 2012 ($1,000)(c) | 1976915 |
| Total retail sales per capita, 2012(c) | $33,875 |
| Transportation | |
| Mean travel time to work (minutes), workers age 16 years+, 2016-2020 | 28.5 |
| Income & Poverty | |
| Median household income (in 2020 dollars), 2016-2020 | $59,594 |
| Per capita income in past 12 months (in 2020 dollars), 2016-2020 | $36,112 |
| Persons in poverty, percent | 14.1% |
| Businesses | |
| All firms, 2012 | 10501 |
| Men-owned firms, 2012 | 4934 |
| Women-owned firms, 2012 | 4186 |
| Minority-owned firms, 2012 | 4286 |
| Nonminority-owned firms, 2012 | 5502 |
| Veteran-owned firms, 2012 | 1015 |
| Nonveteran-owned firms, 2012 | 8663 |
| Geography | |
| Population per square mile, 2010 | 2451.4 |
| Land area in square miles, 2010 | 23.08 |
