The nature of housing in Cobb County is often a topic that generates controversy.
How many times have you heard when new construction is proposed that a goal is to “preserve the character of the community?” This is particularly true when multi-family housing and rental property is proposed.
Home values also affect your tax bill in two ways. If your property values go up, your tax bill probably will, too. And if the overall tax digest in the county is too small or too large to meet the county’s budget needs, elected officials have the options of raising the millage rate, keeping it the same, or cutting it.
Plus it’s just interesting to know what the county looks like as a whole in terms of housing.
So part of really understanding your county is to know how people live. And that starts with knowing a bit about what their physical homes are like.
The most reliable source of accurate data on housing is the 5-year American Community Survey. There is a detailed description of what the survey is, and why it’s important, at the bottom of this article. But the 5-year ACS for the years from 2018-2022 was released recently, and is the source of the numbers in this article.
We’ve provided a CSV file that you can load into the spreadsheet of your choice that has not only the data below, but a lot more information about housing in Cobb County.
The basics
Let’s start with the basics of how many housing units are in the county, and what sort of structures there are.
A housing unit isn’t just a building. It’s a space where an individual or family can live. So an apartment building with 20 units is 20 units. A single-family detached house is one unit.
Buildings are structures and can represent one units or multiple units.
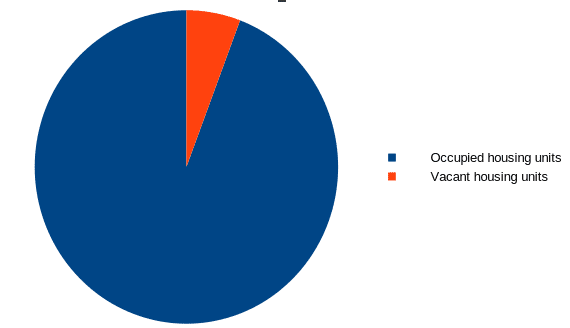
There are 308,949, and at the time the survey was completed 291,171 of them were occupied. The vacancy rate among homeowners is 1 percent, for rental it’s 4.6 percent.
| HOUSING OCCUPANCY | |
| Total housing units | 308949 |
| Occupied housing units | 291171 |
| Vacant housing units | 17778 |
| Homeowner vacancy rate | 1 |
| Rental vacancy rate | 4.6 |
Below is a table that has a count of the residential structures in the county and how many units are in those structures.
| UNITS IN STRUCTURE | ||
| Total housing units | 308949 | |
| 1-unit, detached | 203814 | 66.0% |
| 1-unit, attached | 27062 | 8.8% |
| 2 units | 2091 | 0.7% |
| 3 or 4 units | 5395 | 1.7% |
| 5 to 9 units | 14906 | 4.8% |
| 10 to 19 units | 23732 | 7.7% |
| 20 or more units | 29035 | 9.4% |
| Mobile home | 2789 | 0.9% |
| Boat, RV, van, etc. | 125 | 0.0% |
Here’s the same table sorted:
| Total housing units | 308949 | |
| 1-unit, detached | 203814 | 66.0% |
| 20 or more units | 29035 | 9.4% |
| 1-unit, attached | 27062 | 8.8% |
| 10 to 19 units | 23732 | 7.7% |
| 5 to 9 units | 14906 | 4.8% |
| 3 or 4 units | 5395 | 1.7% |
| Mobile home | 2789 | 0.9% |
| 2 units | 2091 | 0.7% |
| Boat, RV, van, etc. | 125 | 0.0% |
So how many units are owner-occupied and how many renter-occupied?
| Owner-occupied | 193617 |
| Renter-occupied | 97554 |
| Average household size of owner-occupied unit | 2.7 |
| Average household size of renter-occupied unit | 2.39 |
This breaks down to 66.5 percent owner-occupied units and 33.5 percent renter occupied.

Home values are always of interest to the community. Below is a chart showing home values sorted by number of units of that type. Below that there is the table the chart came from with specific numbers of units.
The largest number of owner-occupied homes are in the $300k to $499k range and the smallest is $50,000 to $99,000.
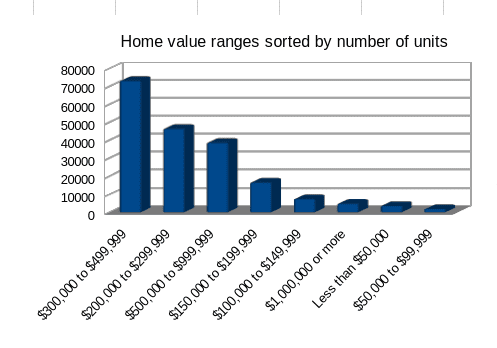
| $300,000 to $499,999 | 73291 |
| $200,000 to $299,999 | 46679 |
| $500,000 to $999,999 | 38918 |
| $150,000 to $199,999 | 16686 |
| $100,000 to $149,999 | 7545 |
| $1,000,000 or more | 4866 |
| Less than $50,000 | 3709 |
| $50,000 to $99,999 | 1923 |
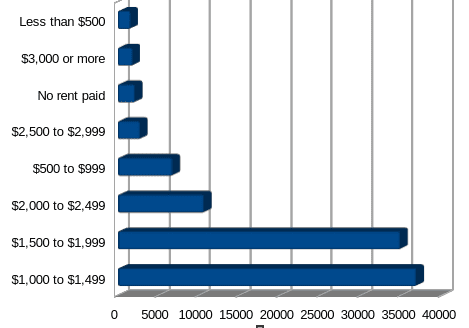
And what about rental rates?
Here’s a table along with a chart:
| Occupied units paying rent | 95427 |
| $1,000 to $1,499 | 36906 |
| $1,500 to $1,999 | 34916 |
| $2,000 to $2,499 | 10674 |
| $500 to $999 | 6766 |
| $2,500 to $2,999 | 2763 |
| No rent paid | 2127 |
| $3,000 or more | 1830 |
| Less than $500 | 1572 |
| Median (dollars) | 1535 |
What about the ages of housing units in the county? Here’s a chart of the ages of units sorted by numbers of units, followed by the table the chart was generated from.
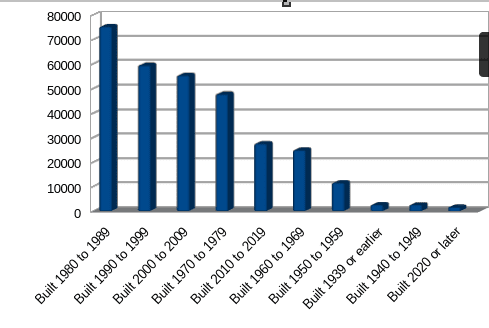
| Age | Number | Percent |
| Built 1980 to 1989 | 75329 | 24.4% |
| Built 1990 to 1999 | 59533 | 19.3% |
| Built 2000 to 2009 | 55442 | 17.9% |
| Built 1970 to 1979 | 47745 | 15.5% |
| Built 2010 to 2019 | 27548 | 8.9% |
| Built 1960 to 1969 | 24963 | 8.1% |
| Built 1950 to 1959 | 11591 | 3.8% |
| Built 1939 or earlier | 2602 | 0.8% |
| Built 1940 to 1949 | 2542 | 0.8% |
| Built 2020 or later | 1654 | 0.5% |
What is the American Community Survey?
The American Community Survey (ACS) is a vital ongoing demographic survey conducted by the United States Census Bureau. It serves as a comprehensive source of information about the American population and its characteristics. Unlike the decennial census, which occurs once every ten years, the ACS is conducted continuously throughout the year, providing more up-to-date and detailed data.
The ACS collects information on various topics, including age, gender, race, ethnicity, education, housing, income, employment, and more. It aims to provide a detailed and accurate snapshot of the nation’s social, economic, and housing conditions. The survey’s primary purpose is to assist government agencies, policymakers, researchers, businesses, and communities in making informed decisions and allocating resources effectively.
Each year, the ACS samples around 3.5 million households across the United States and Puerto Rico. It gathers data through a combination of mailed questionnaires, telephone interviews, and in-person visits, depending on the response method chosen by the sampled household. The survey employs a rolling sample design, ensuring that data from various geographic areas are collected continuously, resulting in a diverse and representative dataset.
The ACS data is crucial for various purposes, such as determining the distribution of federal funds for programs like Medicaid, housing assistance, and transportation infrastructure. Additionally, it assists businesses in market research and helps local governments plan for infrastructure development and public services.
The Cobb County Courier considers the ACS the most important data source in the Census Bureau except during redistricting, which uses the decennial census.
This article briefly looks at the latest housing characteristics in Cobb County via the 2022 5-year American Community Survey