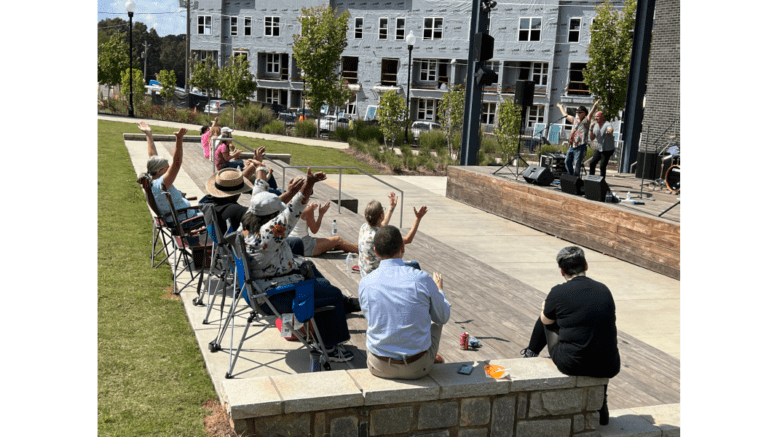
Photo above: A lunchtime crowd enjoys the pop/rock setlist performed by Incentive during the City of Powder Springs’ Brown Bag Lunch Concert offering on Sept. 21, 2023. Held each September in previous years, the city’s Brown Bag Lunch Concert Series is adding in 2024 four April bookings ahead of its annual autumn return, with the free concerts taking place from noon to 1 p.m. each Thursday in both April and September. Photo courtesy Jon Gargis/City of Powder Springs
This year the City of Powder Springs is adding a special treat for people who love live music while they take their lunch break.
The “Brown Bag Lunch Concert Series”. which usually comes in September, will start its 2024 season with a new April series.
The concerts will be held in the Hardy Family Automotive Amphitheater from noon to 1 p.m. each Thursday in April.
The press release for the series gives the following April schedule:
Kicking off the series April 4 is Bottoms Up Duo, promising a “fun mix of rock & roll, blues, country and R&B.”
April 11’s act Arkose is a multi-instrument duo that will blend hip-hop, jazz, R&B and classic rock for some soothing soulful sounds.
Heating up April 18’s lunch break will be Sons-N-Britches, who have everywhere from Georgia kudzu fields to stages shared with international acts.
Singer-songwriter Sonya Shell closes out the series April 25, coupling her strong, rich and bluesy vocals and her guitar to get concert-goers toes tapping.
Limited park seating is available, but attendees are encouraged to bring chairs or sitting blankets. No tents or umbrellas are allowed inside the park.
September’s Brown Bag Lunch Series acts will be announced sometime this summer.
Visit https://cityofpowdersprings.org to find more details on the concert series and park rules.
About Powder Springs
The City of Powder Springs was incorporated in September of 1883. To read the original incorporation act from the State of Georgia please visit this link.
The area before incorporation had been known as Gunpowder Springs, possibly because of the dark sand in the water.
Powder Springs is the sixth largest city in Cobb County, larger only than nearby Austell.
The U.S. Census Bureau gives the following quick facts about the City of Powder Springs:
| Population | |
| Population Estimates, July 1 2021, (V2021) | 17,083 |
| Population estimates base, April 1, 2020, (V2021) | 16,901 |
| Population, percent change – April 1, 2020 (estimates base) to July 1, 2021, (V2021) | 1.1% |
| Population, Census, April 1, 2020 | 16,887 |
| Population, Census, April 1, 2010 | 13,940 |
| Age and Sex | |
| Persons under 5 years, percent | 6.6% |
| Persons under 18 years, percent | 24.3% |
| Persons 65 years and over, percent | 14.6% |
| Female persons, percent | 56.8% |
| Race and Hispanic Origin | |
| White alone, percent | 34.2% |
| Black or African American alone, percent(a) | 56.0% |
| American Indian and Alaska Native alone, percent(a) | 1.3% |
| Asian alone, percent(a) | 1.5% |
| Native Hawaiian and Other Pacific Islander alone, percent(a) | 0.0% |
| Two or More Races, percent | 2.9% |
| Hispanic or Latino, percent(b) | 14.7% |
| White alone, not Hispanic or Latino, percent | 29.5% |
| Population Characteristics | |
| Veterans, 2016-2020 | 1,356 |
| Foreign born persons, percent, 2016-2020 | 9.6% |
| Housing | |
| Housing units, July 1, 2021, (V2021) | X |
| Owner-occupied housing unit rate, 2016-2020 | 80.1% |
| Median value of owner-occupied housing units, 2016-2020 | $181,000 |
| Median selected monthly owner costs -with a mortgage, 2016-2020 | $1,328 |
| Median selected monthly owner costs -without a mortgage, 2016-2020 | $453 |
| Median gross rent, 2016-2020 | $1,296 |
| Building permits, 2021 | X |
| Families & Living Arrangements | |
| Households, 2016-2020 | 5,570 |
| Persons per household, 2016-2020 | 2.72 |
| Living in same house 1 year ago, percent of persons age 1 year+, 2016-2020 | 89.1% |
| Language other than English spoken at home, percent of persons age 5 years+, 2016-2020 | 15.2% |
| Computer and Internet Use | |
| Households with a computer, percent, 2016-2020 | 94.6% |
| Households with a broadband Internet subscription, percent, 2016-2020 | 91.1% |
| Education | |
| High school graduate or higher, percent of persons age 25 years+, 2016-2020 | 94.1% |
| Bachelor’s degree or higher, percent of persons age 25 years+, 2016-2020 | 39.4% |
| Health | |
| With a disability, under age 65 years, percent, 2016-2020 | 8.6% |
| Persons without health insurance, under age 65 years, percent | 9.4% |
| Economy | |
| In civilian labor force, total, percent of population age 16 years+, 2016-2020 | 67.6% |
| In civilian labor force, female, percent of population age 16 years+, 2016-2020 | 63.5% |
| Total accommodation and food services sales, 2017 ($1,000)(c) | 29,526 |
| Total health care and social assistance receipts/revenue, 2017 ($1,000)(c) | 39,184 |
| Total transportation and warehousing receipts/revenue, 2017 ($1,000)(c) | 7,540 |
| Total retail sales, 2017 ($1,000)(c) | 181,543 |
| Total retail sales per capita, 2017(c) | $12,102 |
| Transportation | |
| Mean travel time to work (minutes), workers age 16 years+, 2016-2020 | 37.6 |
| Income & Poverty | |
| Median household income (in 2020 dollars), 2016-2020 | $72,810 |
| Per capita income in past 12 months (in 2020 dollars), 2016-2020 | $32,601 |
| Persons in poverty, percent | 6.3% |
| Businesses | |
| Total employer establishments, 2020 | X |
| Total employment, 2020 | X |
| Total annual payroll, 2020 ($1,000) | X |
| Total employment, percent change, 2019-2020 | X |
| Total nonemployer establishments, 2019 | X |
| All employer firms, Reference year 2017 | 300 |
| Men-owned employer firms, Reference year 2017 | 134 |
| Women-owned employer firms, Reference year 2017 | S |
| Minority-owned employer firms, Reference year 2017 | S |
| Nonminority-owned employer firms, Reference year 2017 | 170 |
| Veteran-owned employer firms, Reference year 2017 | S |
| Nonveteran-owned employer firms, Reference year 2017 | 247 |
7.17
| Geography | |
| Population per square mile, 2020 | 2,288.5 |
| Population per square mile, 2010 | 1,944.7 |
| Land area in square miles, 2020 | 7.38 |
| Land area in square miles, 2010 |
| Population Estimates, July 1 2021, (V2021) | 17,083 |