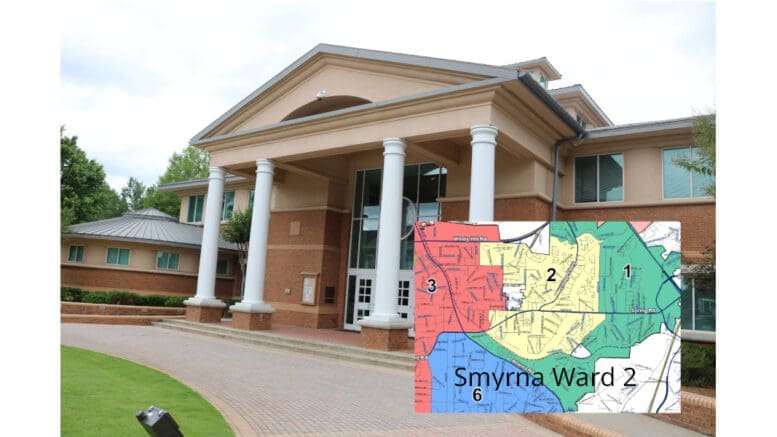
Smyrna Ward 2 Councilwoman Latonia Hines will host a neighborhood meeting tomorrow night, Monday, November 25, 2024, from 6 to 8 p.m., at the Reed House, 3080 Atlanta Road, Smyrna, Georgia 30080.
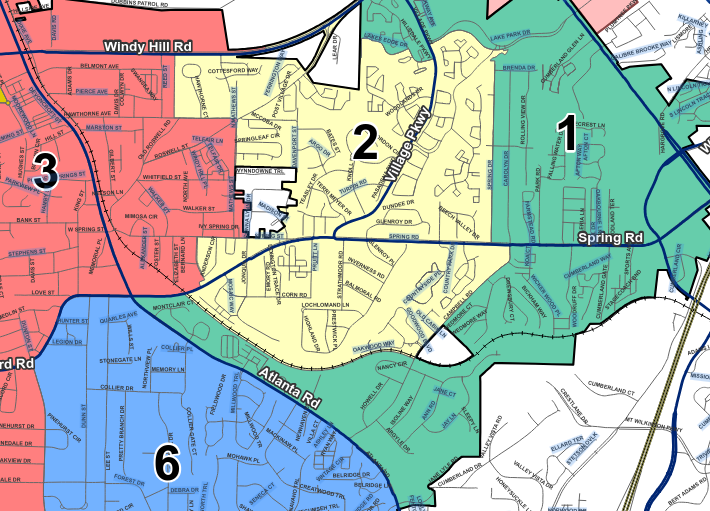
The map below shows the boundaries of Ward 2. For a larger map showing all Smyrna’s wards, follow this link.
Agenda for Ward 2 neighborhood meeting
Date: November 25, 2024
Time: 6 p.m
Location: Reed House
- Roll Call
- Call to Order
- Introduction
- 2024-322 Introductions made by Ward 2 Councilmember Latonia P. Hines
- Formal Business
- 2024-324 Ward 2 news and updates – Councilmember Latonia P. Hines
- 2024-326 2025 Calendar and Events Updates – Councilmember Latonia P. Hines
- Q & A / Additional Comment
- Adjournment
About the City of Smyrna
Smyrna is the third-largest city in Cobb County, after newly incorporated Mableton, and county seat Marietta.
Smyrna was incorporated by an act of the Georgia legislature in 1872. To see a copy of the original incorporation legislation, follow this link.
The U.S. Census Bureau gives the latest quick facts about Smyrna:
| Population | ||
| Population estimates, July 1, 2023, (V2023) | 56,566 | 62,769 |
| Population estimates base, April 1, 2020, (V2023) | 56,201 | 61,073 |
| Population, percent change – April 1, 2020 (estimates base) to July 1, 2023, (V2023) | 0.6% | 2.8% |
| Population, Census, April 1, 2020 | 55,663 | 60,972 |
| Population, Census, April 1, 2010 | 51,271 | 56,579 |
| Age and Sex | ||
| Persons under 5 years, percent | 7.2% | 6.0% |
| Persons under 18 years, percent | 21.9% | 20.7% |
| Persons 65 years and over, percent | 10.0% | 14.2% |
| Female persons, percent | 52.1% | 51.3% |
| Race and Hispanic Origin | ||
| White alone, percent | 45.8% | 45.3% |
| Black or African American alone, percent(a) | 33.2% | 30.8% |
| American Indian and Alaska Native alone, percent(a) | 0.5% | 1.3% |
| Asian alone, percent(a) | 8.1% | 2.1% |
| Native Hawaiian and Other Pacific Islander alone, percent(a) | 0.3% | 0.0% |
| Two or More Races, percent | 6.7% | 8.6% |
| Hispanic or Latino, percent(b) | 11.2% | 18.8% |
| White alone, not Hispanic or Latino, percent | 43.8% | 42.4% |
| Population Characteristics | ||
| Veterans, 2018-2022 | 2,354 | 2,377 |
| Foreign born persons, percent, 2018-2022 | 14.4% | 17.2% |
| Housing | ||
| Housing Units, July 1, 2023, (V2023) | X | X |
| Owner-occupied housing unit rate, 2018-2022 | 57.2% | 46.2% |
| Median value of owner-occupied housing units, 2018-2022 | $380,100 | $376,400 |
| Median selected monthly owner costs -with a mortgage, 2018-2022 | $2,226 | $2,050 |
| Median selected monthly owner costs -without a mortgage, 2018-2022 | $522 | $569 |
| Median gross rent, 2018-2022 | $1,553 | $1,372 |
| Building Permits, 2023 | X | X |
| Families & Living Arrangements | ||
| Households, 2018-2022 | 24,694 | 24,403 |
| Persons per household, 2018-2022 | 2.25 | 2.39 |
| Living in same house 1 year ago, percent of persons age 1 year+, 2018-2022 | 82.5% | 79.1% |
| Language other than English spoken at home, percent of persons age 5 years+, 2018-2022 | 19.1% | 24.3% |
| Computer and Internet Use | ||
| Households with a computer, percent, 2018-2022 | 98.1% | 97.2% |
| Households with a broadband Internet subscription, percent, 2018-2022 | 96.5% | 91.3% |
| Education | ||
| High school graduate or higher, percent of persons age 25 years+, 2018-2022 | 95.5% | 88.5% |
| Bachelor’s degree or higher, percent of persons age 25 years+, 2018-2022 | 57.6% | 45.8% |
| Health | ||
| With a disability, under age 65 years, percent, 2018-2022 | 5.9% | 6.7% |
| Persons without health insurance, under age 65 years, percent | 12.9% | 21.6% |
| Economy | ||
| In civilian labor force, total, percent of population age 16 years+, 2018-2022 | 78.2% | 67.6% |
| In civilian labor force, female, percent of population age 16 years+, 2018-2022 | 74.3% | 61.1% |
| Total accommodation and food services sales, 2017 ($1,000)(c) | 228,468 | 282,938 |
| Total health care and social assistance receipts/revenue, 2017 ($1,000)(c) | 302,559 | 2,324,868 |
| Total transportation and warehousing receipts/revenue, 2017 ($1,000)(c) | 103,015 | 492,100 |
| Total retail sales, 2017 ($1,000)(c) | 1,605,300 | 2,099,654 |
| Total retail sales per capita, 2017(c) | $28,582 | $34,643 |
| Transportation | ||
| Mean travel time to work (minutes), workers age 16 years+, 2018-2022 | 28.5 | 27.3 |
| Income & Poverty | ||
| Median household income (in 2022 dollars), 2018-2022 | $92,258 | $67,589 |
| Per capita income in past 12 months (in 2022 dollars), 2018-2022 | $59,851 | $40,767 |
| Persons in poverty, percent | 8.0% | 12.8% |
| Businesses | ||
| Total employer establishments, 2022 | X | X |
| Total employment, 2022 | X | X |
| Total annual payroll, 2022 ($1,000) | X | X |
| Total employment, percent change, 2021-2022 | X | X |
| Total nonemployer establishments, 2021 | X | X |
| All employer firms, Reference year 2017 | 1,687 | 3,152 |
| Men-owned employer firms, Reference year 2017 | 965 | 1,993 |
| Women-owned employer firms, Reference year 2017 | 331 | S |
| Minority-owned employer firms, Reference year 2017 | 337 | 505 |
| Nonminority-owned employer firms, Reference year 2017 | 1,097 | 2,146 |
| Veteran-owned employer firms, Reference year 2017 | S | 193 |
| Nonveteran-owned employer firms, Reference year 2017 | 1,319 | 2,443 |
| Geography | ||
| Population per square mile, 2020 | 3,578.5 | 2,602.0 |
| Population per square mile, 2010 | 3,339.5 | 2,451.4 |
| Land area in square miles, 2020 | 15.56 | 23.43 |
| Land area in square miles, 2010 | 15.35 | 23.08 |
| FIPS Code | 1371492 | 1349756 |
| Population estimates, July 1, 2023, (V2023) | 56,566 | 62,769 |
As a resident of Hilldale Condos on Village Pkwy, I have to wonder why our community was jerrymandered into 2 separate wards. It is despicable!! Also wondering why someone would hold a ward meeting when people are leaving town for the holiday. I CALL BS!!!!