Cobb County announced on its website that this year’s State of the County address by Cobb Board of Commissioners Chairwoman Lisa Cupid will be at Jim Miller Park on Thursday, March 31 at 7 p.m.
The announcement on the county website, reprinted below, has further information:
Save the date for the 2022 Cobb County State of the County, 7 p.m. Thursday, Mar. 31 at the Jim R. Miller Park.
If you would like to attend, please RSVP here.
At the address, Chairwoman Lisa Cupid will recognize those who are “All-in” for Cobb, demonstrating integrity, inclusiveness, investment in others, innovation, and intelligent Decision-Making for the County.If you would like to submit a person, business, or organization for the award, please submit nominations and RSVP by March 20 on this site: https://form.jotform.com/220622332704141
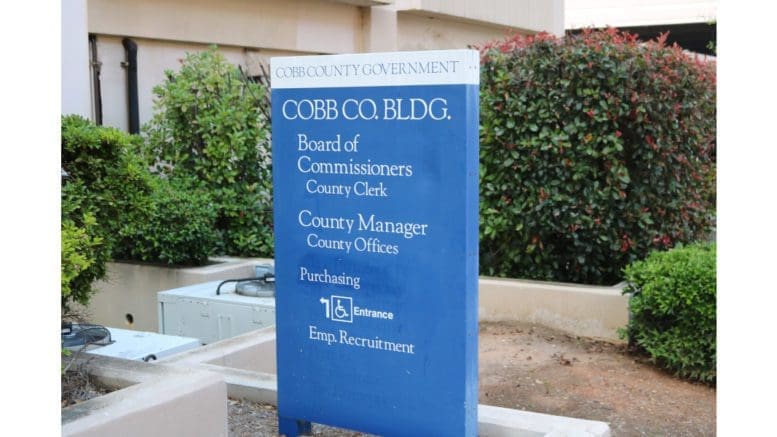
About Cobb County
Cobb County is the third most populous county in Georgia, after Fulton and Gwinnett counties, although Cobb is now in a near-tie with Dekalb County, which now has 764,382 residents.
Its county seat is Marietta, and it was one of nine counties created in 1832 when a large portion of north Georgia was stolen from the Cherokee in violation of treaties and of a decision by the Supreme Court against removal.
This resulted in the infamous Trail of Tears, where 4,000 Cherokee died on a forced walk of more than 1,000 miles.
The county, which stayed rural for much of its existence, began growing rapidly in the post-war period after the wartime construction of the Bell Bomber plant, the move of Lockheed Martin onto the Bell Bomber grounds after the war, and the growth of Cobb as a bedroom community to the adjacent City of Atlanta.
Below are the demographics in Cobb, based on the 2020 decennial census.
| Population, Census, April 1, 2020 | 766,149 |
| Population, Census, April 1, 2010 | 688,078 |
| Age and Sex | |
|---|---|
| Persons under 5 years, percent | 6.1% |
| Persons under 18 years, percent | 23.3% |
| Persons 65 years and over, percent | 12.7% |
| Female persons, percent | 51.5% |
| Race and Hispanic Origin | |
| White alone, percent | 62.4% |
| Black or African American alone, percent(a) | 28.8% |
| American Indian and Alaska Native alone, percent(a) | 0.5% |
| Asian alone, percent(a) | 5.6% |
| Native Hawaiian and Other Pacific Islander alone, percent(a) | 0.1% |
| Two or More Races, percent | 2.6% |
| Hispanic or Latino, percent(b) | 13.3% |
| White alone, not Hispanic or Latino, percent | 51.1% |
| Population Characteristics | |
| Veterans, 2015-2019 | 41,345 |
| Foreign born persons, percent, 2015-2019 | 15.7% |
| Housing | |
| Housing units, July 1, 2019, (V2019) | 304,819 |
| Owner-occupied housing unit rate, 2015-2019 | 64.5% |
| Median value of owner-occupied housing units, 2015-2019 | $253,900 |
| Median selected monthly owner costs -with a mortgage, 2015-2019 | $1,633 |
| Median selected monthly owner costs -without a mortgage, 2015-2019 | $471 |
| Median gross rent, 2015-2019 | $1,202 |
| Building permits, 2020 | 2,494 |
| Families & Living Arrangements | |
| Households, 2015-2019 | 280,374 |
| Persons per household, 2015-2019 | 2.64 |
| Living in same house 1 year ago, percent of persons age 1 year+, 2015-2019 | 83.9% |
| Language other than English spoken at home, percent of persons age 5 years+, 2015-2019 | 20.9% |
| Computer and Internet Use | |
| Households with a computer, percent, 2015-2019 | 96.5% |
| Households with a broadband Internet subscription, percent, 2015-2019 | 91.6% |
| Education | |
| High school graduate or higher, percent of persons age 25 years+, 2015-2019 | 92.1% |
| Bachelor’s degree or higher, percent of persons age 25 years+, 2015-2019 | 47.4% |
| Health | |
| With a disability, under age 65 years, percent, 2015-2019 | 5.9% |
| Persons without health insurance, under age 65 years, percent | 14.4% |
| Economy | |
| In civilian labor force, total, percent of population age 16 years+, 2015-2019 | 70.1% |
| In civilian labor force, female, percent of population age 16 years+, 2015-2019 | 64.5% |
| Total accommodation and food services sales, 2012 ($1,000)(c) | 1,516,090 |
| Total health care and social assistance receipts/revenue, 2012 ($1,000)(c) | 3,519,689 |
| Total manufacturers shipments, 2012 ($1,000)(c) | 8,587,163 |
| Total retail sales, 2012 ($1,000)(c) | 10,368,694 |
| Total retail sales per capita, 2012(c) | $14,657 |
| Transportation | |
| Mean travel time to work (minutes), workers age 16 years+, 2015-2019 | 31.9 |
| Income & Poverty | |
| Median household income (in 2019 dollars), 2015-2019 | $77,932 |
| Per capita income in past 12 months (in 2019 dollars), 2015-2019 | $40,031 |
| Persons in poverty, percent | 9.2% |
BUSINESSES
| Businesses | |
|---|---|
| Total employer establishments, 2019 | 20,869 |
| Total employment, 2019 | 360,023 |
| Total annual payroll, 2019 ($1,000) | 21,888,536 |
| Total employment, percent change, 2018-2019 | 1.5% |
| Total nonemployer establishments, 2018 | 83,097 |
| All firms, 2012 | 80,947 |
| Men-owned firms, 2012 | 41,717 |
| Women-owned firms, 2012 | 31,390 |
| Minority-owned firms, 2012 | 31,280 |
| Nonminority-owned firms, 2012 | 46,785 |
| Veteran-owned firms, 2012 | 7,431 |
| Nonveteran-owned firms, 2012 | 69,782 |
GEOGRAPHY
| Geography | |
|---|---|
| Population per square mile, 2010 | 2,026.4 |
| Land area in square miles, 2010 | 339.55 |
| FIPS Code | 13067 |