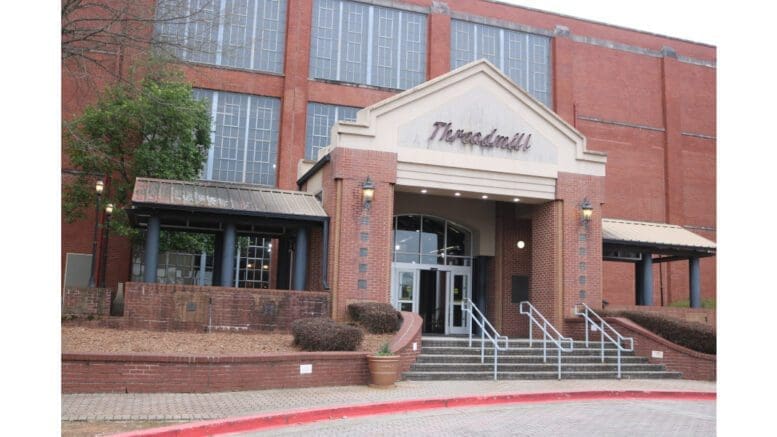
The City of Austell announced the return for a second year of its BBQ Blues & Brews festival.
The event will take place at the Threadmill Complex, at 5000 Austell Powder Springs Rd Austell, GA 30106, on Saturday, October 7, 2023 from noon until 10 p.m.
According to the press release for the event, “Family-friendly activities will be available all day, with college football on TV displays, a Cornhole tournament sponsored by Cornhole ATL, and a BBQ competition with a $1500 grand prize.”
The festival will include live performances by The Danny Miller Band, Cannonball Red & The Headhunters, J Hop, Garrett Collins, and a headline performance from Grammy-nominated Jontavious Willis.
Application for sponsorship and vendors are open now.
Sponsorships and proceeds will go towards community programming for local youth and their families.
The press release states, “As the Austell community grows, events like the Blues & Brews invite residents and their neighbors to join in fellowship and build relationships.”
About the City of Austell
The smallest city in Cobb County with a population of just under 8,000, the City of Austell was incorporated on September 4, 1885.
The original city limits of the town were a circle with a radius of one-half mile from a railway terminal used by the Georgia Pacific Railway Company and the East Tennessee, Virginia and Georgia Railroad Company.
The U.S. Census Bureau provides the following quick facts about the city:
| Population Estimates, July 1, 2022, (V2022) | 7,896 |
| Population | |
| Population Estimates, July 1, 2022, (V2022) | 7,896 |
| Population estimates base, April 1, 2020, (V2022) | 7,710 |
| Population, percent change – April 1, 2020 (estimates base) to July 1, 2022, (V2022) | 2.4% |
| Population, Census, April 1, 2020 | 7,713 |
| Population, Census, April 1, 2010 | 6,581 |
| Age and Sex | |
| Persons under 5 years, percent | 4.6% |
| Persons under 18 years, percent | 28.9% |
| Persons 65 years and over, percent | 8.2% |
| Female persons, percent | 52.4% |
| Race and Hispanic Origin | |
| White alone, percent | 29.9% |
| Black or African American alone, percent(a) | 61.9% |
| American Indian and Alaska Native alone, percent(a) | 0.0% |
| Asian alone, percent(a) | 0.0% |
| Native Hawaiian and Other Pacific Islander alone, percent(a) | 0.0% |
| Two or More Races, percent | 6.0% |
| Hispanic or Latino, percent(b) | 8.0% |
| White alone, not Hispanic or Latino, percent | 25.1% |
| Population Characteristics | |
| Veterans, 2017-2021 | 385 |
| Foreign born persons, percent, 2017-2021 | 4.6% |
| Housing | |
| Housing units, July 1, 2022, (V2022) | X |
| Owner-occupied housing unit rate, 2017-2021 | 60.0% |
| Median value of owner-occupied housing units, 2017-2021 | $156,000 |
| Median selected monthly owner costs -with a mortgage, 2017-2021 | $1,268 |
| Median selected monthly owner costs -without a mortgage, 2017-2021 | $317 |
| Median gross rent, 2017-2021 | $1,258 |
| Building permits, 2022 | X |
| Families & Living Arrangements | |
| Households, 2017-2021 | 2,802 |
| Persons per household, 2017-2021 | 2.92 |
| Living in same house 1 year ago, percent of persons age 1 year+, 2017-2021 | 93.4% |
| Language other than English spoken at home, percent of persons age 5 years+, 2017-2021 | 10.7% |
| Computer and Internet Use | |
| Households with a computer, percent, 2017-2021 | 96.6% |
| Households with a broadband Internet subscription, percent, 2017-2021 | 93.0% |
| Education | |
| High school graduate or higher, percent of persons age 25 years+, 2017-2021 | 87.8% |
| Bachelor’s degree or higher, percent of persons age 25 years+, 2017-2021 | 21.8% |
| Health | |
| With a disability, under age 65 years, percent, 2017-2021 | 6.5% |
| Persons without health insurance, under age 65 years, percent | 20.5% |
| Economy | |
| In civilian labor force, total, percent of population age 16 years+, 2017-2021 | 73.0% |
| In civilian labor force, female, percent of population age 16 years+, 2017-2021 | 70.6% |
| Total accommodation and food services sales, 2017 ($1,000)(c) | D |
| Total health care and social assistance receipts/revenue, 2017 ($1,000)(c) | 524,040 |
| Total transportation and warehousing receipts/revenue, 2017 ($1,000)(c) | 29,462 |
| Total retail sales, 2017 ($1,000)(c) | D |
| Total retail sales per capita, 2017(c) | NA |
| Transportation | |
| Mean travel time to work (minutes), workers age 16 years+, 2017-2021 | 29.2 |
| Income & Poverty | |
| Median household income (in 2021 dollars), 2017-2021 | $59,459 |
| Per capita income in past 12 months (in 2021 dollars), 2017-2021 | $24,230 |
| Persons in poverty, percent | 5.1% |
| Businesses | |
| Total employer establishments, 2021 | X |
| Total employment, 2021 | X |
| Total annual payroll, 2021 ($1,000) | X |
| Total employment, percent change, 2020-2021 | X |
| Total nonemployer establishments, 2019 | X |
| All employer firms, Reference year 2017 | 219 |
| Men-owned employer firms, Reference year 2017 | 104 |
| Women-owned employer firms, Reference year 2017 | 64 |
| Minority-owned employer firms, Reference year 2017 | S |
| Nonminority-owned employer firms, Reference year 2017 | 101 |
| Veteran-owned employer firms, Reference year 2017 | S |
| Nonveteran-owned employer firms, Reference year 2017 | 172 |
| Geography | |
| Population per square mile, 2020 | 1,299.8 |
| Population per square mile, 2010 | 1,102.5 |
| Land area in square miles, 2020 | 5.93 |
| Land area in square miles, 2010 | 5.97 |
| FIPS Code | 1304252 |
