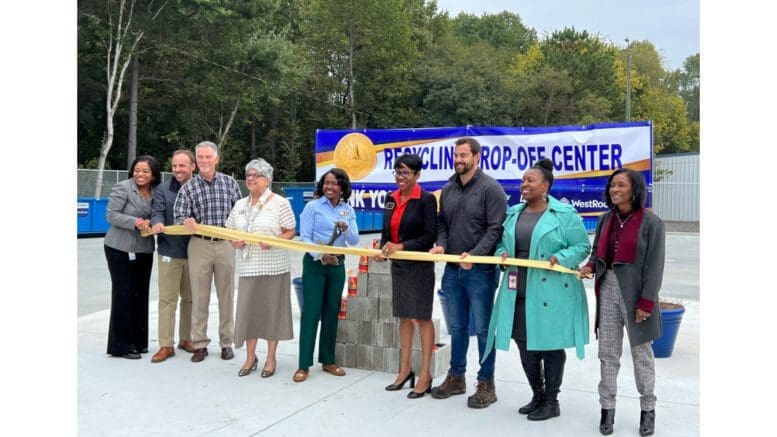
Cobb BOC Chairwoman Lisa Cupid cuts ribbon with Commissioners JoAnn Birrell (L) and Monique Sheffield (R) flanking her. Photo provided by Barry Krebs.
from Barry Krebs
Barry Krebs is well known in Mableton and other parts of south Cobb for the wide variety of volunteer work he does with Keep Cobb Beautiful, the South Cobb Lions Club, Sweetwater Mission, and First Christian Church of Mableton.
Barry often sends reports, photos and announcements to the Courier, highlighting cleanups, volunteer activities, and community resources in south Cobb.
He recently sent us the following account of Westrock Recycling Center’s ribbon-cutting after extensive renovation:
Many of our community leaders and elected officials were present for the Westrock Recycling Center Ribbon Cutting.
The recently renovated recycling center located off County Services Road in Marietta was repaved with many new features including glass and Hefty Renewal Bags (formerly Hefty Energy Bags) recycling.
Commissioner Sheffield gave thanks to a District 4 citizen, Mr. Walden, who recognized an opportunity to improve upon the current facility.
Mr. Walden along with (then) Keep Cobb Beautiful Executive Director, Kimberly White proved that persistence pays.
Kimberly hosted the event and the guest speakers provided us with many interesting facts.
Did you know that only 17% of Cobb County residents recycle? Our goal is 50%. The 17% is close to the Georgia average.
The US average recycling rate is 32% with many northeastern states above the 50% mark.
So, Cobb County has a lot of upside potential. Much of the glass that is recycled is used at our local fiberglass plants. The plastics are used with our local bottlers and carpet factories.


About Cobb County
Cobb County is the third most populous county in Georgia, smaller only than Fulton and Gwinnett counties.
The governing authority is the five-member Cobb County Board of Commissioners, which includes a Chairperson and four district commissioners.
The current board is:
| Chairwoman | Lisa Cupid |
| District 1 Commissioner | Keli Gambrill |
| District 2 Commissioner | Jerica Richardson |
| District 3 Commissioner | JoAnn Birrell |
| District 4 Commissioner | Monique Sheffield |
The U.S. Census Bureau gives the following quick facts about the county:
| PeoplePopulation | |
| Population Estimates, July 1 2021, (V2021) | 766,802 |
| Population estimates base, April 1, 2020, (V2021) | 766,149 |
| Population, percent change – April 1, 2020 (estimates base) to July 1, 2021, (V2021) | 0.1% |
| Population, Census, April 1, 2020 | 766149 |
| Population, Census, April 1, 2010 | 688078 |
| Age and Sex | |
| Persons under 5 years, percent | 5.6% |
| Persons under 18 years, percent | 22.7% |
| Persons 65 years and over, percent | 13.3% |
| Female persons, percent | 51.3% |
| Race and Hispanic Origin | |
| White alone, percent | 61.7% |
| Black or African American alone, percent(a) | 29.2% |
| American Indian and Alaska Native alone, percent(a) | 0.5% |
| Asian alone, percent(a) | 5.7% |
| Native Hawaiian and Other Pacific Islander alone, percent(a) | 0.1% |
| Two or More Races, percent | 2.8% |
| Hispanic or Latino, percent(b) | 13.7% |
| White alone, not Hispanic or Latino, percent | 50.2% |
| Population Characteristics | |
| Veterans, 2016-2020 | 40562 |
| Foreign born persons, percent, 2016-2020 | 15.6% |
| Housing | |
| Housing units, July 1, 2021, (V2021) | 311450 |
| Owner-occupied housing unit rate, 2016-2020 | 65.8% |
| Median value of owner-occupied housing units, 2016-2020 | $273,900 |
| Median selected monthly owner costs -with a mortgage, 2016-2020 | $1,672 |
| Median selected monthly owner costs -without a mortgage, 2016-2020 | $474 |
| Median gross rent, 2016-2020 | $1,264 |
| Building permits, 2021 | 3247 |
| Families & Living Arrangements | |
| Households, 2016-2020 | 283359 |
| Persons per household, 2016-2020 | 2.63 |
| Living in same house 1 year ago, percent of persons age 1 year+, 2016-2020 | 84.6% |
| Language other than English spoken at home, percent of persons age 5 years+, 2016-2020 | 20.5% |
| Computer and Internet Use | |
| Households with a computer, percent, 2016-2020 | 97.2% |
| Households with a broadband Internet subscription, percent, 2016-2020 | 93.3% |
| Education | |
| High school graduate or higher, percent of persons age 25 years+, 2016-2020 | 92.6% |
| Bachelor’s degree or higher, percent of persons age 25 years+, 2016-2020 | 48.4% |
| Health | |
| With a disability, under age 65 years, percent, 2016-2020 | 6.2% |
| Persons without health insurance, under age 65 years, percent | 13.8% |
| Economy | |
| In civilian labor force, total, percent of population age 16 years+, 2016-2020 | 69.6% |
| In civilian labor force, female, percent of population age 16 years+, 2016-2020 | 64.3% |
| Total accommodation and food services sales, 2017 ($1,000)(c) | 2056579 |
| Total health care and social assistance receipts/revenue, 2017 ($1,000)(c) | 5569500 |
| Total transportation and warehousing receipts/revenue, 2017 ($1,000)(c) | 1536858 |
| Total retail sales, 2017 ($1,000)(c) | 18543691 |
| Total retail sales per capita, 2017(c) | $24,615 |
| Transportation | |
| Mean travel time to work (minutes), workers age 16 years+, 2016-2020 | 31.2 |
| Income & Poverty | |
| Median household income (in 2020 dollars), 2016-2020 | $80,830 |
| Per capita income in past 12 months (in 2020 dollars), 2016-2020 | $41,480 |
| Persons in poverty, percent | 9.2% |
| BusinessesBusinesses | |
| Total employer establishments, 2020 | 21492 |
| Total employment, 2020 | 358927 |
| Total annual payroll, 2020 ($1,000) | 21780372 |
| Total employment, percent change, 2019-2020 | -0.3% |
| Total nonemployer establishments, 2019 | 86497 |
| All employer firms, Reference year 2017 | 17066 |
| Men-owned employer firms, Reference year 2017 | 10386 |
| Women-owned employer firms, Reference year 2017 | 3537 |
| Minority-owned employer firms, Reference year 2017 | 3058 |
| Nonminority-owned employer firms, Reference year 2017 | 12177 |
| Veteran-owned employer firms, Reference year 2017 | 1204 |
| Nonveteran-owned employer firms, Reference year 2017 | 13909 |
| GeographyGeography | |
| Population per square mile, 2020 | 2254.8 |
| Population per square mile, 2010 | 2026.4 |
| Land area in square miles, 2020 | 339.78 |
| Land area in square miles, 2010 | 339.55 |