By Mark Woolsey
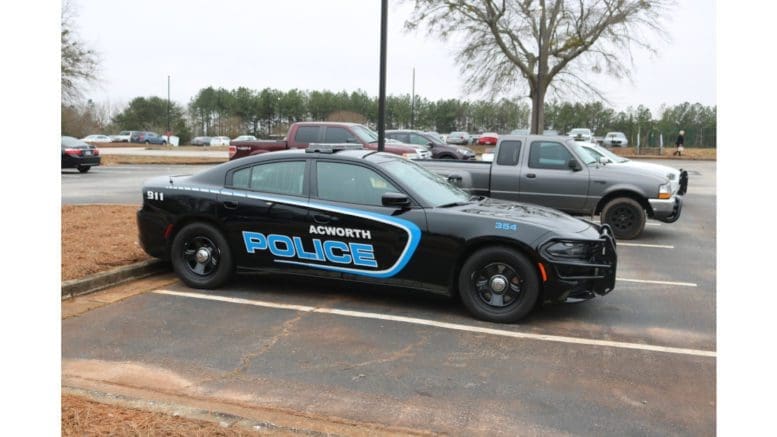
An Acworth police officer’s swift action saved the life of a choking victim on Wednesday, police spokesman Sgt. Eric Mistretta told the Courier.
Police said in a Facebook post that officers responded to a medical emergency about 10:30 a.m. near New McEver Road and Acworth Industrial Drive. A driver named Steven Williams told authorities that he was choking on a water bottle cap, but that he’d been able to pull over and contact 9-1-1 for help.
Corporal Tamara Severtson was first to arrive. Police say she assessed the situation then deployed her department-issued LifeVac device, quickly and effectively removing the cap from Williams’ airway.
Williams was then checked out at the scene and was expected to make a full recovery.
The department purchased the LifeVac devices for every officer in 2024. It’s the second time Severtson has deployed the piece of equipment to help a choking victim.
About the City of Acworth
Acworth started as a railroad depot for the Western & Atlantic Railroad. An engineer for the W&A, Joseph Gregg, named the depot for his hometown of Acworth, New Hampshire.
It is the fifth largest city by population after Mableton, Marietta, Smyrna, and Kennesaw.
Acworth was incorporated as a city in 1860.
The following quick facts about Acworth were taken from the U.S. Census Bureau website.
| Population | |
| Population estimates, July 1, 2024, (V2024) | NA |
| Population estimates, July 1, 2023, (V2023) | 22,379 |
| Population estimates base, April 1, 2020, (V2024) | NA |
| Population estimates base, April 1, 2020, (V2023) | 22,464 |
| Population, percent change – April 1, 2020 (estimates base) to July 1, 2024, (V2024) | NA |
| Population, percent change – April 1, 2020 (estimates base) to July 1, 2023, (V2023) | -0.4% |
| Population, Census, April 1, 2020 | 22,440 |
| Population, Census, April 1, 2010 | 20,425 |
| Age and Sex | |
| Persons under 5 years, percent | 4.8% |
| Persons under 18 years, percent | 25.4% |
| Persons 65 years and over, percent | 12.3% |
| Female persons, percent | 53.9% |
| Race and Hispanic Origin | |
| White alone, percent | 58.2% |
| Black alone, percent (a)(a) | 20.4% |
| American Indian and Alaska Native alone, percent (a)(a) | 0.0% |
| Asian alone, percent (a)(a) | 2.7% |
| Native Hawaiian and Other Pacific Islander alone, percent (a)(a) | 0.0% |
| Two or More Races, percent | 9.4% |
| Hispanic or Latino, percent (b)(b) | 16.9% |
| White alone, not Hispanic or Latino, percent | 53.9% |
| Population Characteristics | |
| Veterans, 2019-2023 | 1,194 |
| Foreign-born persons, percent, 2019-2023 | 17.7% |
| Housing | |
| Housing Units, July 1, 2023, (V2023) | X |
| Owner-occupied housing unit rate, 2019-2023 | 61.2% |
| Median value of owner-occupied housing units, 2019-2023 | $309,800 |
| Median selected monthly owner costs – with a mortgage, 2019-2023 | $1,680 |
| Median selected monthly owner costs -without a mortage, 2019-2023 | $584 |
| Median gross rent, 2019-2023 | $1,569 |
| Building Permits, 2023 | X |
| Families & Living Arrangements | |
| Households, 2019-2023 | 8,327 |
| Persons per household, 2019-2023 | 2.68 |
| Living in the same house 1 year ago, percent of persons age 1 year+ , 2019-2023 | 87.8% |
| Language other than English spoken at home, percent of persons age 5 years+, 2019-2023 | 27.7% |
| Computer and Internet Use | |
| Households with a computer, percent, 2019-2023 | 96.0% |
| Households with a broadband Internet subscription, percent, 2019-2023 | 89.2% |
| Education | |
| High school graduate or higher, percent of persons age 25 years+, 2019-2023 | 90.6% |
| Bachelor’s degree or higher, percent of persons age 25 years+, 2019-2023 | 32.9% |
| Health | |
| With a disability, under age 65 years, percent, 2019-2023 | 8.0% |
| Persons without health insurance, under age 65 years, percent | 19.2% |
| Economy | |
| In civilian labor force, total, percent of population age 16 years+, 2019-2023 | 72.8% |
| In civilian labor force, female, percent of population age 16 years+, 2019-2023 | 66.3% |
| Total accommodation and food services sales, 2022 ($1,000)(c) | 142,623 |
| Total health care and social assistance receipts/revenue, 2022 ($1,000)(c) | 148,990 |
| Total transportation and warehousing receipts/revenue, 2022 ($1,000)(c) | 53,970 |
| Total retail sales, 2022 ($1,000)(c) | 714,112 |
| Total retail sales per capita, 2022(c) | $32,022 |
| Transportation | |
| Mean travel time to work (minutes), workers age 16 years+, 2019-2023 | 30.7 |
| Income & Poverty | |
| Median households income (in 2023 dollars), 2019-2023 | $80,703 |
| Per capita income in past 12 months (in 2023 dollars), 2019-2023 | $38,353 |
| Persons in poverty, percent | 8.3% |
| Businesses | |
| Total employer establishments, 2022 | X |
| Total employment, 2022 | X |
| Total annual payroll, 2022 ($1,000) | X |
| Total employment, percent change, 2021-2022 | X |
| Total nonemployer establishments, 2022 | X |
| All employer firms, Reference year 2022 | 526 |
| Men-owned employer firms, Reference year 2022 | 304 |
| Women-owned employer firms, Reference year 2022 | S |
| Minority-owned employer firms, Reference year 2022 | 69 |
| Nonminority-owned employer firms, Reference year 2022 | 318 |
| Veteran-owned employer firms, Reference year 2022 | 18 |
| Nonveteran-owned employer firms, Reference year 2022 | 367 |
| Geography | |
| Population per square mile, 2020 | 2,488.4 |
| Population per square mile, 2010 | 2,477.6 |
| Land area in square miles, 2020 | 9.02 |
| Land area in square miles, 2010 | 8.24 |