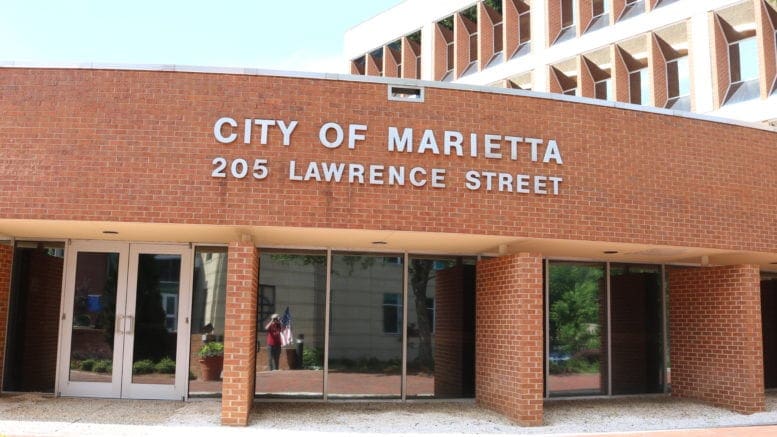
The City of Marietta has proposed changes to the use of funds it is receiving from Community Development Block Grants (CDBG).
This will require an amendment to the CDBG PY2023-2027 Consolidated Plan and PY23 Annual Action Plan, the documents that describe how the city is planning to use the funds they receive from the program.
These changes will, in turn, require a 30-day period of accepting comments from the public.
Here is the city’s official announcement, that includes the ways residents can submit comments:
The City of Marietta is advertising a proposed Substantial Amendment to its CDBG PY2023-2027 Consolidated Plan and PY23 Annual Action Plan. The proposed amendment includes the following reallocations:
| Reallocated From: | Amount: | Reallocated To: |
| PY22 Housing Rehabilitation Service Delivery | $39,039.47 | PY2023 Housing Rehabilitation |
| PY22 ELD Emergency Grants | $58,814.20 | PY2023 Housing Rehabilitation |
| PY22 Program Income | $32,844.34 | PY2023 Housing Rehabilitation |
A total of $130,698.01 will be reallocated to PY23 Housing Rehabilitation.
This Amendment is classified as substantial and warrants a minimum 30-day Public Comment period. The Public Comment period begins November 6th , 2023 and ends December 8th, 2023. An in-person public hearing will be held on November 29th, 2023 at 11:00 AM at the Community Development Office. 268 Lawrence St., Marietta, GA 30060. All comments can be submitted by mail, email or through phone. Please direct all comments/inquiries to: Kelsey Thompson-White. 268 Lawrence Street, Suite 200, Marietta, GA 30060; Telephone: 770-794-5437 or e-mail to: kthompson@mariettaga.gov. All comments must be received by 5:00 PM on December 8th, 2023.
About the Community Development Block Grant program
The Community Development Block grant program is administered by the U.S. Department of Housing and Urban Development.
The HUD website describes the program as follows:
The Community Development Block Grant (CDBG) Program provides annual grants on a formula basis to states, cities, and counties to develop viable urban communities by providing decent housing and a suitable living environment, and by expanding economic opportunities, principally for low- and moderate-income persons. The program is authorized under Title 1 of the Housing and Community Development Act of 1974, Public Law 93-383, as amended 42 U.S.C. 5301 et seq. The program was designed to reinforce several important values and principles of community development:
- CDBG’s flexibility empowers people and communities to design and implement strategies tailored to their own needs and priorities.
- CDBG’s emphasis on consolidated planning expands and strengthens partnerships among all levels of government and the private sector in enhancing community development.
- CDBG’s technical assistance activities and set-aside for grantees builds the capacity of these partners.
About the City of Marietta
The City of Marietta is the county seat of Cobb County. The latest estimate from the U.S. Census Bureau puts the population of the city at 60,867 which makes it the second largest city in Cobb County by population, smaller only than the newly incorporated City of Mableton.
Here are a few quick facts from the Census Bureau
| Marietta city, Georgia | |
| Population, Census, April 1, 2020 | 60972 |
| Population, Census, April 1, 2010 | 56579 |
| Age and Sex | |
| Persons under 5 years, percent | 6.7% |
| Persons under 18 years, percent | 21.8% |
| Persons 65 years and over, percent | 13.2% |
| Female persons, percent | 49.9% |
| Race and Hispanic Origin | |
| White alone, percent | 53.4% |
| Black or African American alone, percent(a) | 32.3% |
| American Indian and Alaska Native alone, percent(a) | 0.6% |
| Asian alone, percent(a) | 1.9% |
| Native Hawaiian and Other Pacific Islander alone, percent(a) | 0.0% |
| Two or More Races, percent | 4.7% |
| Hispanic or Latino, percent(b) | 15.7% |
| White alone, not Hispanic or Latino, percent | 46.4% |
| Population Characteristics | |
| Veterans, 2016-2020 | 2678 |
| Foreign born persons, percent, 2016-2020 | 16.6% |
| Housing | |
| Owner-occupied housing unit rate, 2016-2020 | 44.0% |
| Median value of owner-occupied housing units, 2016-2020 | $310,100 |
| Median selected monthly owner costs -with a mortgage, 2016-2020 | $1,856 |
| Median selected monthly owner costs -without a mortgage, 2016-2020 | $526 |
| Median gross rent, 2016-2020 | $1,145 |
| Families & Living Arrangements | |
| Households, 2016-2020 | 24148 |
| Persons per household, 2016-2020 | 2.39 |
| Living in same house 1 year ago, percent of persons age 1 year+, 2016-2020 | 77.9% |
| Language other than English spoken at home, percent of persons age 5 years+, 2016-2020 | 23.7% |
| Computer and Internet Use | |
| Households with a computer, percent, 2016-2020 | 95.1% |
| Households with a broadband Internet subscription, percent, 2016-2020 | 86.6% |
| Education | |
| High school graduate or higher, percent of persons age 25 years+, 2016-2020 | 88.6% |
| Bachelor’s degree or higher, percent of persons age 25 years+, 2016-2020 | 44.0% |
| Health | |
| With a disability, under age 65 years, percent, 2016-2020 | 6.3% |
| Persons without health insurance, under age 65 years, percent | 20.2% |
| Economy | |
| In civilian labor force, total, percent of population age 16 years+, 2016-2020 | 67.2% |
| In civilian labor force, female, percent of population age 16 years+, 2016-2020 | 61.2% |
| Total accommodation and food services sales, 2012 ($1,000)(c) | 264544 |
| Total health care and social assistance receipts/revenue, 2012 ($1,000)(c) | 1584232 |
| Total manufacturers shipments, 2012 ($1,000)(c) | 1129407 |
| Total retail sales, 2012 ($1,000)(c) | 1976915 |
| Total retail sales per capita, 2012(c) | $33,875 |
| Transportation | |
| Mean travel time to work (minutes), workers age 16 years+, 2016-2020 | 28.5 |
| Income & Poverty | |
| Median household income (in 2020 dollars), 2016-2020 | $59,594 |
| Per capita income in past 12 months (in 2020 dollars), 2016-2020 | $36,112 |
| Persons in poverty, percent | 14.1% |
| Businesses | |
| All firms, 2012 | 10501 |
| Men-owned firms, 2012 | 4934 |
| Women-owned firms, 2012 | 4186 |
| Minority-owned firms, 2012 | 4286 |
| Nonminority-owned firms, 2012 | 5502 |
| Veteran-owned firms, 2012 | 1015 |
| Nonveteran-owned firms, 2012 | 8663 |
| Geography | |
| Population per square mile, 2010 | 2451.4 |
| Land area in square miles, 2010 | 23.08 |


