Registration is open for Marietta City Schools’ Summer Camp in the City. You can register by following this link. The camp is held at Marietta High School.
Summer Camp in the City is open to all metro Atlanta children from rising pre-K (4 years of age by June 1) to grade 6.
The cost is $185 per week, with a $20 discount for siblings. The camp lasts from June 6 to July 22, and according to the website for the camp “each week features a new theme, field trips, and unique activities.”
Financial aid is available for families. To learn more about financial aid opportunities visit this link.
Breakfast and an afternoon snack are provided, but lunch is not. Campers can bring a packed lunch from home, or purchase a weekly lunch pass during registration for $20 per week. Packed lunches from homw are required for the Friday field trips. The lunch pass is good for pre-determined meals from different vendors (listed below):
Monday: Zaxbys’ (Sandwich, cookie, and chips)
Tuesday: Burger King (Plain Burger and fries)
Wednesday: Pizza (2 slices of cheese pizza)
Thursday: Zaxby’s (Sandwich, cookie, and chips)
Friday: Lunch from home for Field Trip Fridays!
>> For more details follow this link to the Marietta Summer Camp in the City website.
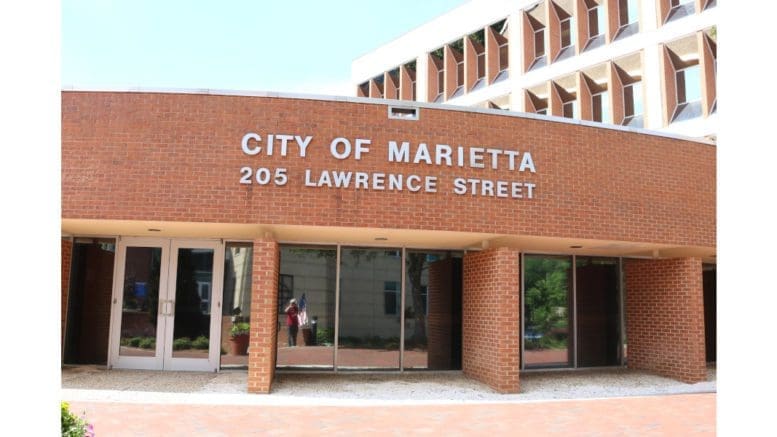
About the City of Marietta
The City of Marietta is the county seat of Cobb County. The latest estimate from the U.S. Census Bureau puts the population of the city at 60,867 which makes it the largest city in Cobb County by population.
However, the city is in a neck-and-neck race with fast-growing Smyrna, whose population was 56,666 at the last estimate.
Here are a few fast facts from the Census Bureau:
Marietta city, Georgia
| Marietta city, Georgia | ||
| People | ||
| Population, Census, April 1, 2020 | 60972 | |
| Population, Census, April 1, 2010 | 56579 | |
| Age and Sex | ||
| Persons under 5 years, percent | 6.7% | |
| Persons under 18 years, percent | 21.8% | |
| Persons 65 years and over, percent | 13.2% | |
| Female persons, percent | 49.9% | |
| Race and Hispanic Origin | ||
| White alone, percent | 53.4% | |
| Black or African American alone, percent(a) | 32.3% | |
| American Indian and Alaska Native alone, percent(a) | 0.6% | |
| Asian alone, percent(a) | 1.9% | |
| Native Hawaiian and Other Pacific Islander alone, percent(a) | 0.0% | |
| Two or More Races, percent | 4.7% | |
| Hispanic or Latino, percent(b) | 15.7% | |
| White alone, not Hispanic or Latino, percent | 46.4% | |
| Population Characteristics | ||
| Veterans, 2016-2020 | 2678 | |
| Foreign born persons, percent, 2016-2020 | 16.6% | |
| Housing | ||
| Owner-occupied housing unit rate, 2016-2020 | 44.0% | |
| Median value of owner-occupied housing units, 2016-2020 | $310,100 | |
| Median selected monthly owner costs -with a mortgage, 2016-2020 | $1,856 | |
| Median selected monthly owner costs -without a mortgage, 2016-2020 | $526 | |
| Median gross rent, 2016-2020 | $1,145 | |
| Families & Living Arrangements | ||
| Households, 2016-2020 | 24148 | |
| Persons per household, 2016-2020 | 2.39 | |
| Living in same house 1 year ago, percent of persons age 1 year+, 2016-2020 | 77.9% | |
| Language other than English spoken at home, percent of persons age 5 years+, 2016-2020 | 23.7% | |
| Computer and Internet Use | ||
| Households with a computer, percent, 2016-2020 | 95.1% | |
| Households with a broadband Internet subscription, percent, 2016-2020 | 86.6% | |
| Education | ||
| High school graduate or higher, percent of persons age 25 years+, 2016-2020 | 88.6% | |
| Bachelor’s degree or higher, percent of persons age 25 years+, 2016-2020 | 44.0% | |
| Health | ||
| With a disability, under age 65 years, percent, 2016-2020 | 6.3% | |
| Persons without health insurance, under age 65 years, percent | 20.2% | |
| Economy | ||
| In civilian labor force, total, percent of population age 16 years+, 2016-2020 | 67.2% | |
| In civilian labor force, female, percent of population age 16 years+, 2016-2020 | 61.2% | |
| Total accommodation and food services sales, 2012 ($1,000)(c) | 264544 | |
| Total health care and social assistance receipts/revenue, 2012 ($1,000)(c) | 1584232 | |
| Total manufacturers shipments, 2012 ($1,000)(c) | 1129407 | |
| Total retail sales, 2012 ($1,000)(c) | 1976915 | |
| Total retail sales per capita, 2012(c) | $33,875 | |
| Transportation | ||
| Mean travel time to work (minutes), workers age 16 years+, 2016-2020 | 28.5 | |
| Income & Poverty | ||
| Median household income (in 2020 dollars), 2016-2020 | $59,594 | |
| Per capita income in past 12 months (in 2020 dollars), 2016-2020 | $36,112 | |
| Persons in poverty, percent | 14.1% | |
Businesses | ||
| All firms, 2012 | 10501 | |
| Men-owned firms, 2012 | 4934 | |
| Women-owned firms, 2012 | 4186 | |
| Minority-owned firms, 2012 | 4286 | |
| Nonminority-owned firms, 2012 | 5502 | |
| Veteran-owned firms, 2012 | 1015 | |
| Nonveteran-owned firms, 2012 | 8663 | |
Geography | ||
| Population per square mile, 2010 | 2451.4 | |
| Land area in square miles, 2010 | 23.08 |