Cobb County is no stranger to disasters. We had major flooding in 2009, and last September we were slammed with floods that were serious enough to make residents eligible for SBA disaster loans.
Arguments between opponents and proponents of new residential and commercial developments about the possibility of flooding are a regular feature at Cobb zoning hearings.
In January we published and article “How resilient are Cobb residents in the face of disaster? The Census Community Resilience Estimates” that described the U.S. Census Bureau’s Community Resilience Estimates.
This week the Census Bureau published a story on how the Federal Emergency Management Agency (FEMA) can use data from the resiliency estimates to determine how to prepare for disasters in advance.
What are the Community Resilience Estimates?
The Census Bureau describes community resilience, and their estimates, as follows:
Community resilience is the capacity of individuals and households to absorb, endure, and recover from the health, social, and economic impacts of a disaster such as a hurricane or pandemic. When disasters occur, recovery depends on the community’s ability to withstand the effects of the event. In order to facilitate disaster preparedness, the Census Bureau has developed new small area estimates, identifying communities where resources and information may effectively mitigate the impact of disasters.
How does the Census Bureau determine ability to recover?
The way the ranking in the capacity to recover from a disaster is determined is by counting the number of risk factors from a list for individuals and households, and sorting them into those with no risk factors, those with 1 or 2 risk factors, and those with three or more risk factors.
Then the census bureau determines how many people or households are in each of those three categories for each census tract.
If that seems too confusing, just think of it as how many people in each census tract are prepared to deal with a disaster.
The risk factors, determined by data from the 2019 American Community Survey, include:
- Income to Poverty Ratio
- Single or Zero Caregiver Household
- Crowding
- Communication Barrier
- Households without Full-time, Year-round Employment
- Disability
- No Health Insurance
- Age 65+
- No Vehicle Access
- No Broadband Internet Access
What do the resilience estimates have to do with FEMA?
In describing what the resiliency estimates mean for FEMA, the Census Bureau wrote:
A new U.S. Census Bureau tool is helping the Federal Emergency Management Agency (FEMA) gauge the number of people particularly vulnerable to disasters like these because they are more “at risk.”
The Community Resilience Estimates (CRE) tool provides an important metric to measure the risk of every neighborhood in the United States should disaster strike.
Having prior estimates of community resilience are vital to FEMA efforts: The CRE can help determine outreach services, the number and type of personnel to deploy and disaster assistance programs that can be activated to aid affected areas.
It can also provide insight into a community’s capacity to recover from a disaster, and where it will need the most help.
The tool designates “at-risk” populations by determining if a person has three or more factors that make them especially vulnerable, such as no health insurance, no vehicle, a disability or a low income-to-poverty ratio.
Some of the ways the tools from the census can help FEMA help residents are
- to determine how many people may qualify for its Individuals and Households Program.
- determine eligibility for individual assistance that can include funds for temporary housing, repair or replacement of owner-occupied home, funds for an uninsured or under-insured disaster-caused expense and hazard mitigation assistance.
- help FEMA determine community eligibility to apply to the Public Assistance Program, “which aids state, local, tribal and territorial governments, and nonprofit organizations so they’ll be ready to respond to and aid communities in the event of major disasters or emergencies declared by the President.”
The Public Assistance Program helps with debris cleanup, restoration of damaged structures, and disaster mitigation measures for publicly owned facilities and some private nonprofit facilities.
What do the resilience estimates mean for Cobb County?
To see how FEMA’s use of the census tools, we’ll look at how Cobb stands on the estimates.
How does Cobb County fare overall? 43.4 percent of Cobb’s population have no risk factors that hinder disaster recovery, 40.8 percent have 1 or 2 risk factors, and 15.9 percent have 3 or more risk factors that would make weathering and recovering a disaster more difficult.
There are a number of ways to look at this, and we’ll examine them in future articles, but this time we’ll focus on the most at-risk people.
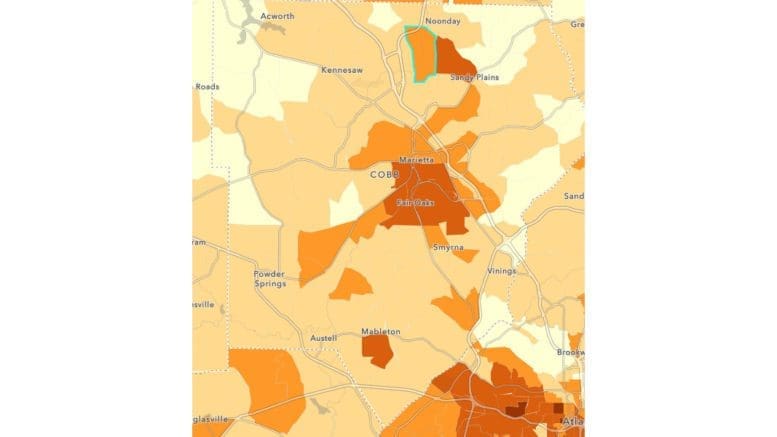
This screenshot of the map of Cobb County from the interactive tool displays so the darkest areas are the areas at the highest risk.
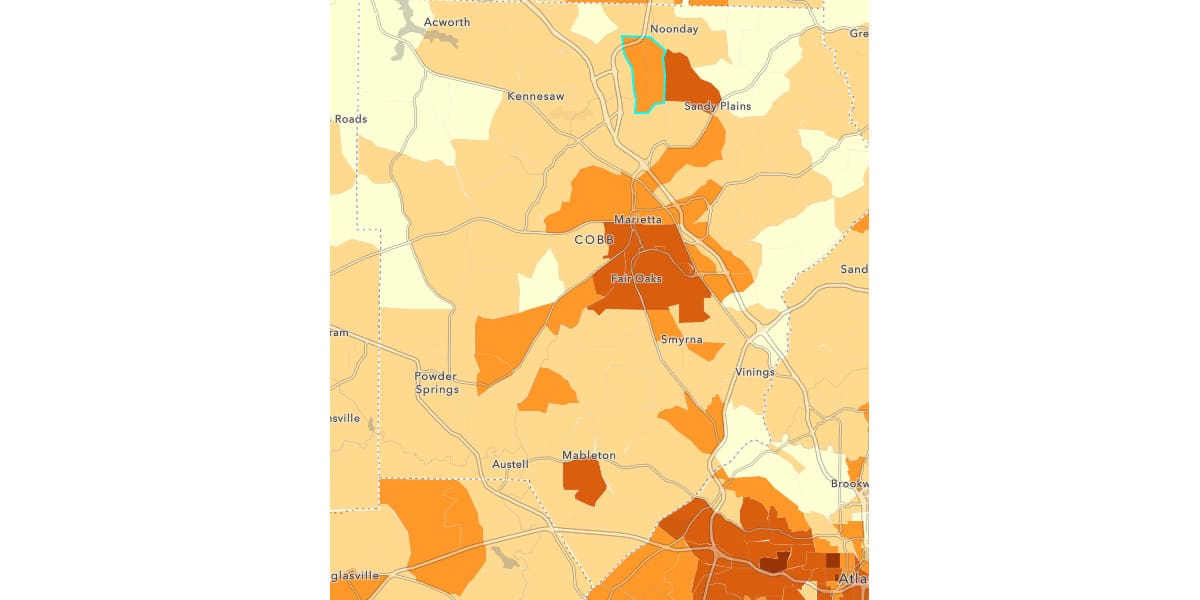
This top-level view shows that the areas at highest risk are a cluster of five census tracts in the Marietta and Fair Oaks communities, a census tract south of Veterans Memorial bordered by James Road and Mableton Parkway in Mableton, and a census tract east of Town Center bordered by Canton Road and Ebenezer Road.
Census tracts with more than 30 percent of population with 3 or more risk factors
| TRACT | percentage with 3 or more risk factors | Community |
| 31308 | 37.58 | Mableton/Austell |
| 31001 | 36.47 | Marietta/Fair Oaks |
| 30800 | 36.29 | Marietta/Fair Oaks |
| 30902 | 35.7 | Marietta/Fair Oaks |
| 30904 | 33.24 | Marietta/Fair Oaks |
| 31002 | 32.78 | Marietta/Fair Oaks |
| 30312 | 31.02 | Canton Road/Ebenezer Road |
Complete list of tracts sorted from highest risk to lowest
| TRACT | percentage with 3 or more risk factors |
| 31308 | 37.58 |
| 31001 | 36.47 |
| 30800 | 36.29 |
| 30902 | 35.7 |
| 30904 | 33.24 |
| 31002 | 32.78 |
| 30312 | 31.02 |
| 30700 | 29.01 |
| 30414 | 27.54 |
| 31101 | 26.04 |
| 31206 | 25.5 |
| 30412 | 25.14 |
| 30313 | 24.78 |
| 30405 | 24.54 |
| 30505 | 22.85 |
| 31111 | 22.74 |
| 31503 | 22.19 |
| 31406 | 22.08 |
| 30905 | 22.02 |
| 30413 | 21.96 |
| 30602 | 21.04 |
| 30502 | 20.91 |
| 31507 | 20.26 |
| 30103 | 19.97 |
| 31116 | 19.88 |
| 31106 | 19.64 |
| 30410 | 19.29 |
| 31509 | 18.88 |
| 31311 | 18.36 |
| 31004 | 18.22 |
| 30504 | 17.83 |
| 31118 | 17.79 |
| 31115 | 17.66 |
| 30223 | 17.59 |
| 30229 | 17.56 |
| 31306 | 17.56 |
| 31310 | 17.37 |
| 31108 | 17.12 |
| 30104 | 16.74 |
| 31506 | 16.65 |
| 30409 | 16.63 |
| 31309 | 16.2 |
| 30227 | 16.16 |
| 31212 | 15.95 |
| 30507 | 15.85 |
| 30106 | 15.71 |
| 30231 | 15.61 |
| 30601 | 15.5 |
| 31404 | 15.4 |
| 30230 | 15.39 |
| 30329 | 15.35 |
| 31110 | 15.32 |
| 31114 | 15.17 |
| 31307 | 15.08 |
| 31312 | 14.84 |
| 30334 | 14.68 |
| 30239 | 14.6 |
| 31113 | 14.39 |
| 30506 | 14.06 |
| 30328 | 13.97 |
| 30408 | 13.92 |
| 30311 | 13.78 |
| 30407 | 13.76 |
| 31005 | 13.54 |
| 30411 | 13.45 |
| 30901 | 13.41 |
| 31409 | 13.35 |
| 31508 | 13.26 |
| 31408 | 12.9 |
| 31405 | 12.86 |
| 31207 | 12.74 |
| 30331 | 12.62 |
| 30330 | 12.53 |
| 31505 | 12.47 |
| 30218 | 12.33 |
| 30220 | 12.31 |
| 30332 | 12.2 |
| 31209 | 12.17 |
| 30310 | 12.14 |
| 30236 | 12.04 |
| 30228 | 12 |
| 30235 | 12 |
| 30345 | 11.74 |
| 30215 | 11.46 |
| 30224 | 11.46 |
| 30335 | 11.39 |
| 30232 | 11.36 |
| 30319 | 11.11 |
| 30343 | 11.11 |
| 30107 | 10.97 |
| 31112 | 10.81 |
| 31211 | 10.74 |
| 30209 | 10.65 |
| 31117 | 10.62 |
| 30333 | 10.33 |
| 30342 | 10.33 |
| 30226 | 10.26 |
| 31208 | 10.18 |
| 31313 | 10.12 |
| 30318 | 9.54 |
| 30101 | 9.37 |
| 30234 | 9.31 |
| 30324 | 9.21 |
| 30341 | 9.2 |
| 30314 | 9.19 |
| 30238 | 9.17 |
| 30344 | 9.01 |
| 30337 | 8.97 |
| 30233 | 8.89 |
| 30322 | 8.68 |
| 30336 | 8.55 |
| 30214 | 8.36 |
| 31205 | 8.3 |
| 30326 | 8.12 |
| 30219 | 8.07 |
| 30327 | 7.85 |
| 30320 | 7.59 |
| 30339 | 6.8 |
| 30222 | 6.08 |
| 30340 | 5.75 |
So the most obvious approach to prevent the county from suffering long-term damage in disaster would be to focus on improving the numbers on the risk factors listed above.